DYDXUSDT.1DUpon analyzing the DYDX/USDT daily chart, here’s my technical perspective and trading strategy:
Overview of Price Movement:
The chart displays a downtrend highlighted by lower highs, which indicates selling pressure over the time period covered. The recent formation around the $0.816 support level (S1) suggests a potential area of interest for buyers and sellers alike.
Resistance and Support Levels:
Resistance levels are marked at $1.269 (R1) and $1.490 (R2). These levels have acted as significant barriers in the past, halting previous rallies.
The support level at $0.816 is currently being tested. A break below this could see further decline towards lower, uncharted levels.
Technical Indicators:
The MACD is currently flat below the zero line, which typically indicates weak momentum. However, the lack of divergence from the signal line suggests that the selling pressure may be stabilizing.
The RSI is at 35.74, nearing oversold conditions. This could imply potential for a reversal or at least a stabilization in price if buyers begin to see value.
Trading Strategy:
Given the current test of the $0.816 support level, my immediate strategy is to monitor this key level closely for any signs of a strong rebound or further breakdown. A convincing bounce off this support with increased volume could indicate a short-term buying opportunity, aiming for R1 at $1.269 as a primary target.
Conversely, a break below $0.816 with significant volume might lead me to consider a short position, or wait for stabilization at lower levels before reassessing entry points.
Risk Management:
Setting a tight stop-loss just below $0.816 would be critical if opting for a long position, to protect against unexpected further declines.
In the case of a short position, a stop-loss just above $0.816 after the breakdown confirms would be prudent to limit potential losses should the market reverse suddenly.
In conclusion, my approach focuses on reactive trading based on the price action at the key $0.816 level. Observing volume and candlestick patterns around this area will be crucial in determining the market’s next move. I'll remain flexible, ready to adapt to new information and market conditions to optimize trading outcomes.
DYDXUSDT trade ideas

$DYDX sentiment CRYPTOCAP:DYDX
One of the leading DEX is currently at its cyclical low and has lost its strength in the bear market, but we will see what the future has in store for it. It's currently oversold and at a significant support. An upward movement from it's CMP might be a good entry. #NFA #DYOR

DYDX Spot Trade | 1500% or more in 2025 ATHDYDX is poised for a massive breakout in the upcoming 2025 bull market. With strong fundamentals and growing adoption in the DeFi space, a 2000% surge is on the horizon. Buy and hold for long-term gains. 🚀 #DYDX #Crypto #DeFi"


dydxAt best, it is a battle between red and green boxes
If it breaks red, its TPs are clear
Green also breaks the midline of the important channel

DYDX Secondary Trend. Capitulation Zone. Wedge. 30 08 2024Logarithm. Time frame 3 days.
Line chart.
Main trend and this secondary trend zone in it.
DYDX Main trend 30 08 2024

DYDX Main trend 30 08 2024Logarithm. Time frame 1 week. Horizontal channel. Beginning of entry into the capitulation zone (under channel support). Formation of a locally descending wedge, in the final phase of formation (volatility narrowing).
Line chart.
Secondary trend. Wedge.

Dydx to shortDydx is making lower lows and lower highs. while it tried to break its bearish trend unsuccessfully. One can open a short here.
Entry : 1.010
Tp 1 : 0.970
Tp 2 : 0.950
Tp 3 : 0.910
Stop Loss : 1.025

DYDX prepration to RUN!The price has hit the $1 area thrice and has since grown. According to the confirmation of RSI weekly and hourly, we can expect price growth up to the set limits.

dydx/usdt long trade idea.dydx/usdt long trade idea has been shared.
Reasons of taking that trade.
1- Bullish BOS ( Break Of Structure).
2- Bullish FVG.
3- Formed Sell Side Liquidity.
4- Demand zone.

#DYDX/USDT#DYDX
The price is moving in an ascending channel on the 4-hour frame and is sticking to it very well
We have a bounce from a major support area in green at 0.900
We have an uptrend RSI that has been broken upwards which supports the upside
We have a trend to stabilize above the 100 moving average which supports the upside
Entry price 1.02
First target 1.11
Second target 1.20
Third target 1.30

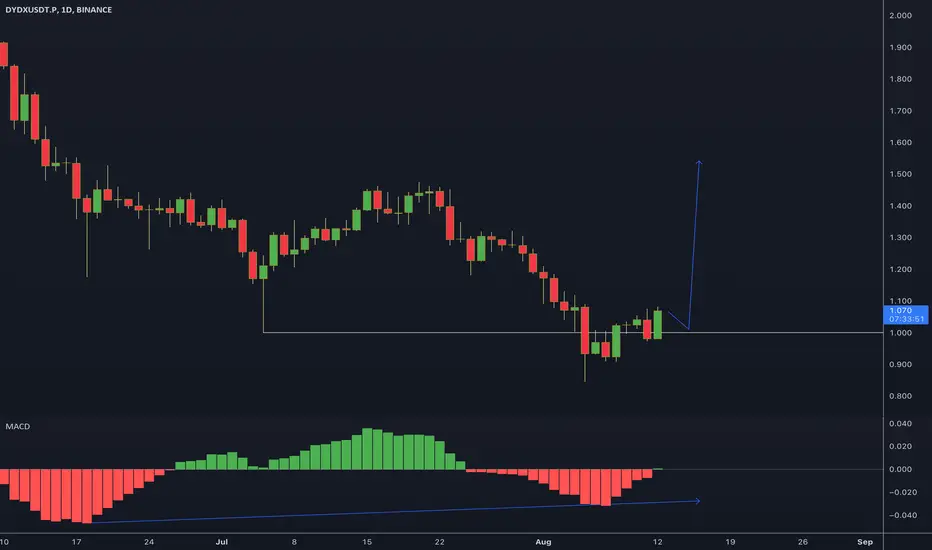
DYDX - swing LONG ideaPrice is potentially a false breakout key low, and many sellers are trapped right now, so if price starts to go higher, they will be closing their short positions, and it provides us with a potential impulse higher.
The main sign of a lack of selling pressure for me is the MACD divergence.

Dxdy To ShortDXDY is at multiple rejection zone. one can open a short entry.
Entry : 1.085
Tp 1 :1.0
Tp 2 : 0.910
Stoploss: 1.135
Follow for more.

DYDX is ready to shortttt! Follow me! tank you.DYDX is ready to start falling after reaching its all-important release, which is much more important to us as the liquidity behind it is cleaned up.
Like and subscribe

Dydx 12H scalpingTake a look on this potential trade BINANCE:DYDXUSDT.P
Possible Targets and explanation idea
➡️12H chart. Black downtrend line and next move out of it with test of 12H IMB
➡️Reaction down retest this line above and continuation with long to main targets
➡️Swiped liquidity at 1.76 with Buy signal on Trade on Indicator
➡️Waiting reaction up with volume
Hope you enjoyed the content I created, You can support with your likes and comments this idea so more people can watch!
✅Disclaimer: Please be aware of the risks involved in trading. This idea was made for educational purposes only not for financial Investment Purposes.

Dydx Equilibrium RetestBINANCE:DYDXUSDT
✅Before we start to discuss, I would be glad if you share your opinion on this post's comment section and hit the like button if you enjoyed it.
Thank you.
Possible Targets and explanation idea
➡️Strong signal to sell on Direction D timeframe
➡️Goin to retest equilibrium of previews Range accumulation
➡️Equilibrium now on same level as 0.786 level
➡️After retest we might see one more rejection on main vol sellers zone
➡️Continuation to our global monthly FVG at 11$
Hope you enjoyed the content I created, You can support with your likes and comments this idea so more people can watch!
✅Disclaimer: Please be aware of the risks involved in trading. This idea was made for educational purposes only not for financial Investment Purposes.
---
• Look at my ideas about interesting altcoins in the related section down below ↓
• For more ideas please hit "Like" and "Follow"!

DYDX - Range deviationTechnically DYDX has been trading within this range for over two years now, so basically going sideways. But given the size of the range it still is very much tradeable if you know the key levels, which are obviously the range highs/lows and the mid-range levels.
Now DYDX has done these deviations before, as I have highlighted in the chart, this time it seems to have deviated the lows of the range for the first time. If this weekly candle closes green, there is a high chance we see a push towards 2$ coming weeks, as this would likely confirm a deviation (stop hunt).
I really don't know if this coin will ever start trending again but I don't think so. Anyway, still a decent long setup with defined risk-reward nonetheless.
Stay safe!

DYDXUSDT.1DAfter reviewing the DYDX/USDT daily chart, it becomes apparent that the asset has encountered a series of fluctuations, manifesting a pattern of peaks and troughs. Let’s delve into the details of the chart’s technical analysis:
Support and Resistance Levels:
Support Level 1 (S1) at $1.027. This level is crucial as it represents a point where the price has previously found buyers stepping in to prevent further declines.
Resistance Level 1 (R1) at $2.491, marking the highest point in the recent uptrend and likely to act as a significant barrier for any upward price movements.
Technical Indicators:
The MACD (Moving Average Convergence Divergence) currently shows a negative divergence with the signal line under the histogram, suggesting bearish momentum. This is further emphasized by the MACD line’s position below zero, indicating that bearish trends could persist.
The RSI (Relative Strength Index) is hovering near the 50 mark, which typically suggests a neutral market condition. However, given the proximity to this level, it suggests that the market is balanced but with a slight tilt towards bearish sentiment.
Conclusion:
From my current analysis, DYDX/USDT appears to be in a precarious position with potential for both upward and downward movements. The pivotal support at $1.027 will be key; if this level holds, it could serve as a foundation for a rebound towards the resistance at $2.491. Conversely, a break below this support could lead to further declines, potentially testing lower levels not seen in the recent past. Given the bearish signals from the MACD, traders should proceed with caution and consider employing risk management strategies such as stop-loss orders to protect against unexpected downturns. Observing the RSI and waiting for a more definitive move out of the neutral territory could also provide better cues for directional trades. As always, staying attuned to broader market trends and news impacting DYDX will be essential in navigating these trades effectively.

DYDX/USDT LONGBuy limit in zone :
1 ( 1.007)
0.786 (1.107)
0.618 (1.186)
Sell limit in zone
0 (1.475)
-0.18 ( 1.559)
-0.27 (1.601)
-0.618 (1.764)

DYDXUSDT 1WDYDX ~ 1W
#DYDX Very strong Support Block for now.
Very interesting to start buying back from here, At least 20%+ upside.

THERE IS TRADE HERE! DYDXHello friends!
DYDX is clearly in a wedge on the 3h chart.
We note that after the recent push, the asset returned a 50% Fibonacci retracement.
So we have a purchase setup here.
Buy in the current range, between 1.20 - 1.15.
Stop: 1.00
Final target: 2.50
Exceptional risk-return ratio.
That's what I'm going to do. And it is not an investment recommendation.
Who will accompany me?
If you like this type of content, follow the trading view and leave your boost!
To the next!

Analyzing DYDX: Current Trends and Future Projections📅 Let's dive into today's analysis, focusing on the DYDX coin in the crypto market.
⌛️ Weekly Timeframe
In this timeframe, DYDX has experienced significant movements. Recently, it saw an upward trend reaching a peak at 24.295, which was a critical supply zone. Following this, the price entered a correction phase with lower volume, suggesting the strength of the previous upward trend. Currently, DYDX is at a support level of 1.800 after a correction phase.
Key Levels:
Resistance: 6.861, 4.068
Support: 1.800, 1.178
📈 If DYDX stabilizes above 2.510, we can anticipate a bullish momentum potentially pushing the price towards the next resistance at 4.068. Confirmation of a new upward trend will depend on candle stability above this level.
📉 Conversely, if DYDX falls back into the range between 1.800 and 2.510, and stabilizes below 1.800, it indicates a bearish trend continuation. The next critical support level would be around 1.178.
📊 In both scenarios, volume analysis is crucial. A healthy trend should be supported by corresponding volume without any divergence.
⌛️ Daily Timeframe
🔍 On the daily chart, DYDX ranged around the 1.450 level before initiating another downward wave. Currently, there is noticeable bearish momentum, and the price has found temporary support at 1.286.
Key Levels:
Resistance: 1.450, 1.590
Support: 1.286, 1.175
🧲 Given the current setup, a stabilization below 1.286 could signal another bearish wave. On the flip side, if the price moves above 1.450, it could indicate the start of a bullish trend, targeting higher resistance levels.
⌛️ 4-Hour Timeframe
📈 In the 4-hour timeframe, DYDX has pulled back to the SMA99 and reached the resistance at 1.450. Volume analysis shows a decrease, indicating potential exhaustion of the recent upward movement.
Key Levels:
Resistance: 1.450, 1.590
Support: 1.286, 1.175
💥 The RSI is currently ranging between 33.26 and 40.45 on different timeframes. Breaking these levels could provide confirmation for opening positions. However, always use these levels in conjunction with candle patterns and volume analysis to find the best entry and exit points.
Conclusion
Given the current bearish signals in the daily and 4-hour timeframes, alongside the potential trend change in the weekly timeframe, I am inclined to open a short position. However, this is based on my trading strategy. Each trader should base their decisions on their strategies and risk management plans.
⚠️ Please note that this is not financial advice. I'm simply introducing this project to you, and remember always to do your own research.
🫶 If you found this analysis helpful and want to support me, please boost this analysis. Feel free to leave a comment or suggest a coin you'd like me to analyze next.
