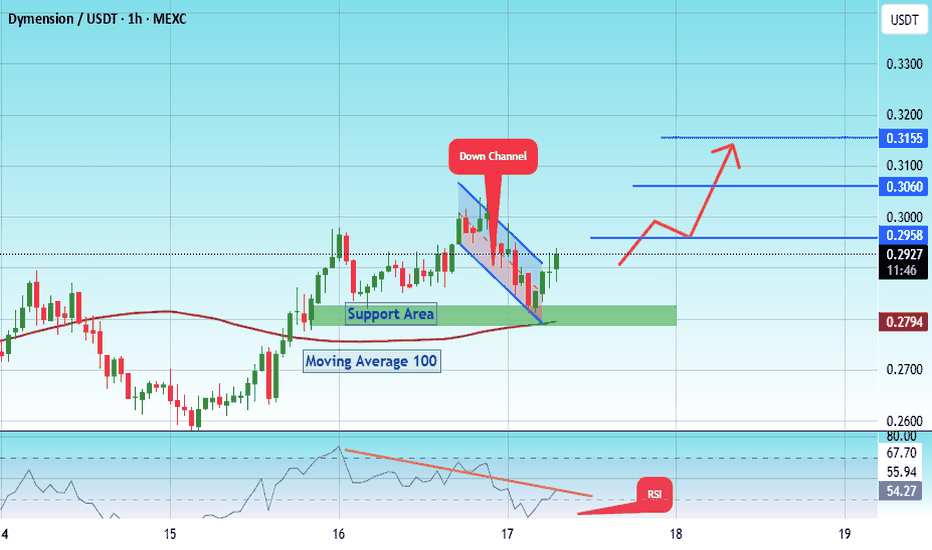
#DYM/USDT#DYM
The price is moving within a descending channel on the 1-hour frame, adhering well to it, and is on its way to breaking strongly upwards and retesting it.
We have support from the lower boundary of the descending channel at 0.2795.
We have a downtrend on the RSI indicator that is about to be broken and retested, supporting the upside.
There is a major support area in green at 0.2746, which represents a strong basis for the upside.
Don't forget a simple thing: ease and capital.
When you reach the first target, save some money and then change your stop-loss order to an entry order.
For inquiries, please leave a comment.
We have a trend to hold above the 100 Moving Average.
Entry price: 0.2860.
First target: 0.2923.
Second target: 0.2976.
Third target: 0.3060.
Don't forget a simple thing: ease and capital.
When you reach your first target, save some money and then change your stop-loss order to an entry order.
For inquiries, please leave a comment.
Thank you.
DYMUSDT trade ideas
#DYM/USDT Dymension's Falling Wedge#DYM
The price is moving within an ascending channel on the 1-hour frame, adhering well to it, and is on track to break it strongly upwards and retest it.
We have support from the lower boundary of the ascending channel, at 0.2550.
We have a downtrend on the RSI indicator that is about to break and retest, supporting the upside.
There is a major support area in green at 0.2583, which represents a strong basis for the upside.
Don't forget a simple thing: ease and capital.
When you reach the first target, save some money and then change your stop-loss order to an entry order.
For inquiries, please leave a comment.
We have a trend to hold above the 100 Moving Average.
Entry price: 0.2730.
First target: 0.2771.
Second target: 0.2832.
Third target: 0.2909.
Don't forget a simple thing: ease and capital.
When you reach your first target, save some money and then change your stop-loss order to an entry order.
For inquiries, please leave a comment.
Thank you.
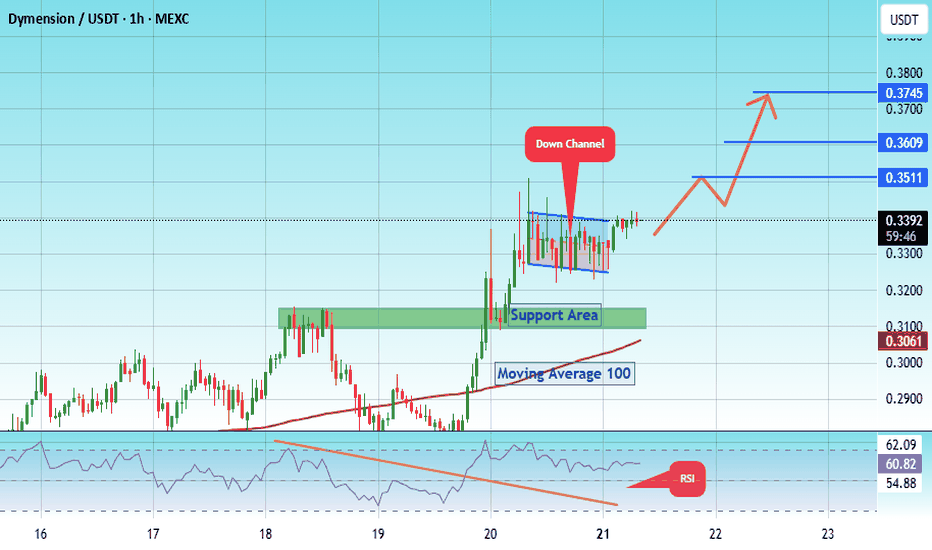
#DYM/USDT Dymension's Falling Wedge #DYM
The price is moving within a descending channel on the 1-hour frame, adhering well to it, and is on its way to breaking strongly upwards and retesting it.
We have support from the lower boundary of the descending channel, at 0.3250.
We have a downtrend on the RSI indicator that is about to be broken and retested, supporting the upside.
There is a major support area in green at 0.3113, which represents a strong basis for the upside.
Don't forget a simple thing: ease and capital.
When you reach the first target, save some money and then change your stop-loss order to an entry order.
For inquiries, please leave a comment.
We have a trend to hold above the 100 Moving Average.
Entry price: 0.3396
First target: 0.3511
Second target: 0.3610
Third target: 0.3745
Don't forget a simple thing: ease and capital.
When you reach your first target, save some money and then change your stop-loss order to an entry order.
For inquiries, please leave a comment.
Thank you.
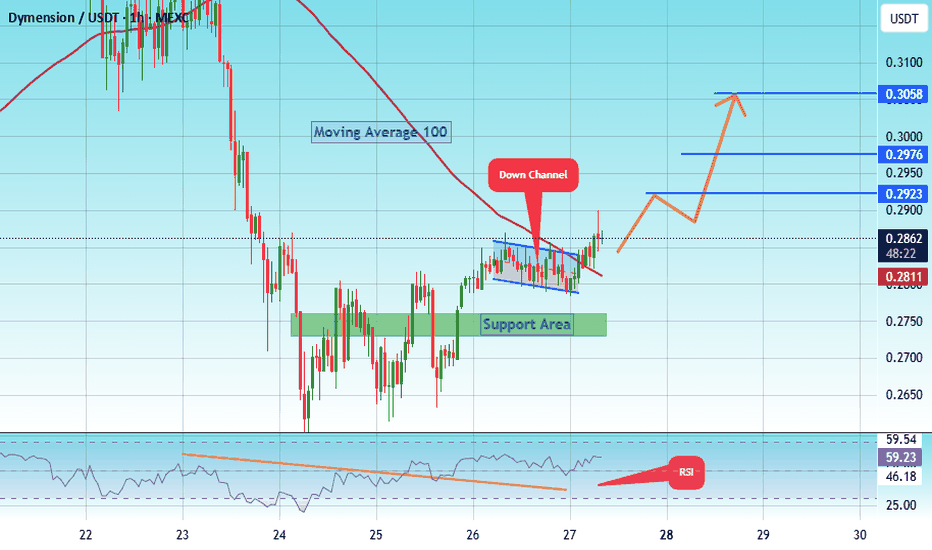
#DYM/USDT Dymension's Falling Wedge#DYM
The price is moving within a descending channel on the 1-hour frame, adhering well to it, and is heading for a strong breakout and retest.
We have a bounce from the lower boundary of the descending channel. This support is at 0.2750.
We have a downtrend on the RSI indicator that is about to be broken and retested, supporting the upside.
There is a major support area in green at 0.2800, which represents a strong basis for the upside.
Don't forget a simple thing: ease and capital.
When you reach the first target, save some money and then change your stop-loss order to an entry order.
For inquiries, please leave a comment.
We have a trend of consolidation above the 100 Moving Average.
Entry price: 0.2920
First target: 0.2958
Second target: 0.3060
Third target: 0.3155
Don't forget a simple thing: ease and capital.
When you reach the first target, save some money and then change your stop-loss order to an entry order.
For inquiries, please leave a comment.
Thank you.
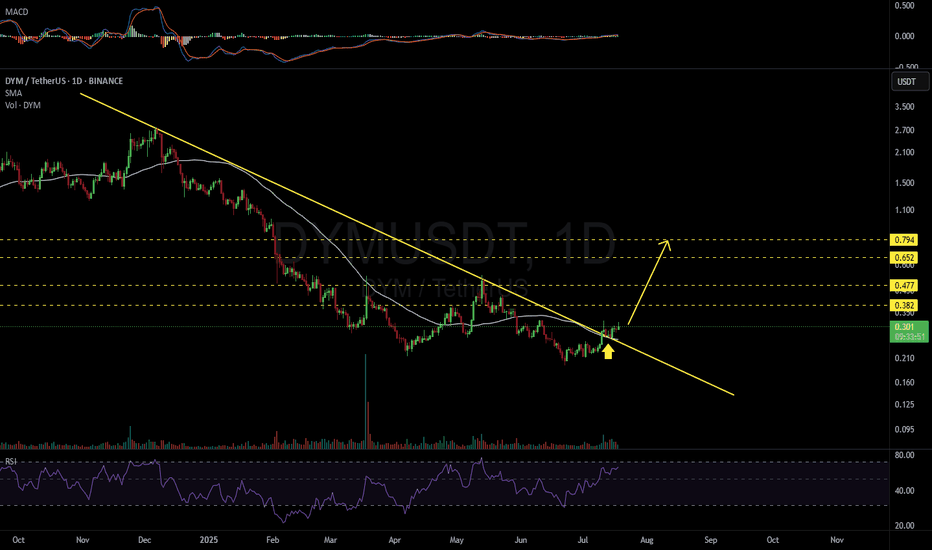
DYM/USDThas been in a 500-day downtrend without any significant pullbacks. Recently, the $0.25 zone acted as a strong support level where buyers stepped in, signaling a potential trend reversal. Volume is gradually picking up, indicating growing interest and accumulation.
This marks our first buy setup, with a target toward the previous local top as the initial take-profit zone.
#DYM/USDT (DYM) - A quick 20 % return#DYM
The price is moving within a descending channel on the 1-hour frame, adhering well to it, and is heading for a strong breakout and retest.
We are experiencing a rebound from the lower boundary of the descending channel. This support is at 2730.
We are experiencing a downtrend on the RSI indicator that is about to be broken and retested, supporting the upside.
There is a major support area in green at 0.2700, which represents a strong basis for the upside.
Don't forget a simple thing: ease and capital.
When you reach the first target, save some money and then change your stop-loss order to an entry order.
For inquiries, please leave a comment.
We are in a consolidation trend above the 100 Moving Average.
Entry price: 0.2828
First target: 0.2889
Second target: 0.2954
Third target: 0.3045
Don't forget a simple thing: ease and capital.
When you reach the first target, save some money and then change your stop-loss order to an entry order.
For inquiries, please leave a comment.
Thank you.
#DYM/USDT DYM’s Comeback ?#DYM
The price is moving within a descending channel on the 15-minute frame and is expected to break it and continue upward.
We have a trend to stabilize above the 100 Moving Average once again.
We have a bearish trend on the RSI indicator, supporting the upward break.
We have a support area at the lower boundary of the channel at 0.2940, acting as strong support from which the price can rebound.
We have a major support area in green that pushed the price upward at 0.2847.
Entry price: 0.3060.
First target: 0.3122.
Second target: 0.3206.
Third target: 0.3317.
To manage risk, don't forget stop loss and capital management.
When you reach the first target, save some profits and then change the stop order to an entry order.
For inquiries, please comment.
Thank you.
#DYM/USDT#DYM
The price is moving within a descending channel on the 1-hour frame, adhering well to it, and is heading for a strong breakout and retest.
We are seeing a bounce from the lower boundary of the descending channel, which is support at 0.2729.
We have a downtrend on the RSI indicator that is about to be broken and retested, supporting the upward trend.
We are looking for stability above the 100 Moving Average.
Entry price: 0.3390
First target: 0.3056
Second target: 0.3210
Third target: 0.3390
#DYM/USDT#DYM
The price is moving within a descending channel on the 1-hour frame, adhering well to it, and is heading toward a strong breakout and retest.
We are experiencing a rebound from the lower boundary of the descending channel. This support is at 0.2480.
We are experiencing a downtrend on the RSI indicator, which is about to break and retest, supporting the upward trend.
We are heading toward stability above the 100 Moving Average.
Entry price: 0.2537
First target: 0.2640
Second target: 0.2713
Third target: 0.2800
#DYM/USDT#DYM
The price is moving within a descending channel on the 1-hour frame and is expected to break and continue upward.
We have a trend to stabilize above the 100 moving average once again.
We have a downtrend on the RSI indicator, which supports the upward move by breaking it upward.
We have a support area at the lower limit of the channel at 0.2232, acting as strong support from which the price can rebound.
Entry price: 0.2316
First target: 0.2384
Second target: 0.2461
Third target: 0.2532
#DYM Dymension's Falling Wedge#DYM
The price is moving within a descending channel on the 1-hour frame, adhering well to it, and is heading for a strong breakout and retest.
We have a bounce from the lower boundary of the descending channel. This support is at 2180.
We have a downtrend on the RSI indicator that is about to be broken and retested, supporting the upside.
There is a major support area in green at 0.2160, which represents a strong basis for the upside.
Don't forget a simple thing: ease and capital.
When you reach the first target, save some money and then change your stop-loss order to an entry order.
For inquiries, please leave a comment.
We have a trend to hold above the 100 Moving Average.
Entry price: 0.2240
First target: 0.2296
Second target: 0.2374
Third target: 0.2462
Don't forget a simple thing: ease and capital.
When you reach the first target, save some money and then change your stop-loss order to an entry order.
For inquiries, please leave a comment.
Thank you.
#DYM Dymension's Falling Wedge#DYM
The price is moving within a descending channel on the 1-hour frame, adhering well to it, and is on its way to breaking it strongly upwards and retesting it.
We have a bounce from the lower boundary of the descending channel. This support is at 0.2130.
We have a downtrend on the RSI indicator that is about to break and retest, supporting the upside.
There is a major support area in green at 0.2100, which represents a strong basis for the upside.
Don't forget a simple thing: ease and capital.
When you reach the first target, save some money and then change your stop-loss order to an entry order.
For inquiries, please leave a comment.
We have a trend to hold above the 100 Moving Average.
Entry price: 0.2220
First target: 0.2276
Second target: 0.2340
Third target: 0.2427
Don't forget a simple thing: ease and capital.
When you reach the first target, save some money and then change your stop-loss order to an entry order.
For inquiries, please leave a comment.
Thank you.
#DYM/USDT#DYM
The price is moving within a descending channel on the 1-hour frame, adhering well to it, and is heading for a strong breakout and retest.
We are seeing a bounce from the lower boundary of the descending channel, which is support at 0.2020.
We have a downtrend on the RSI indicator that is about to be broken and retested, supporting the upward trend.
We are looking for stability above the 100 moving average.
Entry price: 0.2059
First target: 0.2113
Second target: 0.2184
Third target: 0.2273
#DYM/USDT#DYM
The price is moving within a descending channel on the 1-hour frame, adhering well to it, and is heading towards a strong breakout and retest.
We are experiencing a rebound from the lower boundary of the descending channel. This support is at 0.2552.
We are experiencing a downtrend on the RSI indicator, which is about to break and retest, supporting the upward trend.
We are heading towards stability above the 100 Moving Average.
Entry price: 0.2576
First target: 0.2642
Second target: 0.2714
Third target: 0.2808
DYM’s Comeback: Storm Over or More Clouds Ahead?After breaking down from that lovely pattern, DYM is finally showing some strength—pushing above the moving average at last! Not gonna lie, there’s still plenty of resistance on the way up, but the volume on that breakout gave me a bit of hope for a trend reversal. Now, it’s retesting the MA, and fingers crossed it flips to support. Of course, we’ve still got that big red cloud ahead before we can enjoy clear green skies. Hopefully, the worst of the storm is behind us, and we can all sit back and watch the northern lights! 🌌 Targets: $1 & $1.40. Let’s see what happens! 🚀
$dym Dym Dymension Inverse head and shoulder pattern (Bottoming)ASX:DYM Dymension price action is printing an inverse head and shoulders Pattern (Bottoming pattern)
Current Price: $0.361
Neckline Resistance is between 0.361 - 0.363
Price has pulled back from a local high near $0.53
If #dym Neckline Resistance holds then expect higher prices to to reached.
TP1: $0.415
TP2: $0.470
TP3: $0.530
Continuation of which can reach $0.635
Invalidation of this idea is Under 0.33
#DYM/USDT#DYM
The price is moving within a descending channel on the 1-hour frame and is expected to break and continue upward.
We have a trend to stabilize above the 100 moving average once again.
We have a downtrend on the RSI indicator that supports the upward move with a breakout.
We have a support area at the lower limit of the channel at 0.368, acting as strong support from which the price can rebound.
Entry price: 0.382
First target: 0.395
Second target: 0.413
Third target: 0.434
#DYM/USDT#DYM
The price is moving within a descending channel on the 1-hour frame, adhering well to it, and is heading for a strong breakout and retest.
We are seeing a bounce from the lower boundary of the descending channel, which is support at 0.454.
We have a downtrend on the RSI indicator that is about to be broken and retested, supporting the upward trend.
We are looking for stability above the 100 moving average.
Entry price: 0.462
First target: 0.482
Second target: 0.503
Third target: 0.527
#DYM/USDT#DYM
The price is moving within a descending channel on the 1-hour frame, adhering well to it, and is heading for a strong breakout and retest.
We are seeing a bounce from the lower boundary of the descending channel, which is support at 0.380.
We have a downtrend on the RSI indicator that is about to be broken and retested, supporting the upward trend.
We are looking for stability above the 100 moving average.
Entry price: 0.410
First target: 0.430
Second target: 0.445
Third target: 0.461
DYM New Update (3D)It seems a fractal pattern is repeating. The red boxes represent the drop waves, while the green boxes indicate the sideways waves.
It appears that the second drop wave, with over a 92% decline, has ended, and the price has entered a trading range phase.
The price corrections can be considered as opportunities for buy/long positions, and the top of the red box can be regarded as the peak of this wave.
For risk management, please don't forget stop loss and capital management
Comment if you have any questions
Thank You
Dymension —Technical Analysis Works, We Can Time The MarketOnce a recovery is confirmed there is no going back. Technical analysis works, it is an amazing tool and this tool can help us time the market. It can help us know in advance where the market is headed next. Here we have a great example with this DYMUSDT chart.
Once a recovery is confirmed, there is no going back. Here the recovery is the inverted triangle pattern coupled with volume.
On 17-March, a three days session, DYMUSDT (Dymension) produced the highest volume ever. This was a strong green candle but there was a rejection.
This rejection led to a lower low and new All-Time Low. Here is the thing, there was a recovery just a few weeks later.
The last active session, 7-May, produced a full green candle after a higher low. This candle erased all the bearish action after the lower low.
The current 3D session is now full green and trades above the 17-March candle close. This is a complete recovery of the rejection from mid-March.
This recovery reveals two things: (1) The downtrend is over and (2) DYMUSDT is now green.
This chart pattern and price dynamic, reveals what will happen next. Notice that this information is nowhere written on the chart, you have to know where to look and what to look for to be able to extract this information, but the information is present to those that know how to interpret the data.
The chart doesn't predict any specific event. The candles can't be right or wrong, that part is on us. But it is clear that after such behavior by the buyers and sellers of this project their next action will be a wave of buying. This will push prices up. Technical analysis works .
What I like about this chart setup, it is so easy and so simple, yet it has huge potential for growth. With this tool, we can time the market . Being able to time the market successfully calls for a new strategy for those investing and thinking that the way to riches is allocating money into bonds and index funds.
Imagine the same investing strategy, monthly compounding, while at the same time choosing smart.
Buy when prices are low, sell when prices are high while choosing the best possible projects when they are about to blow up.
The end result can be a "Billionaire Teacher," the "Millionaire Teacher" will sound like a bad joke.
10% in the era of Crypto? Bitcoin alone outperforms these numbers already a hundred fold.
Namaste.


