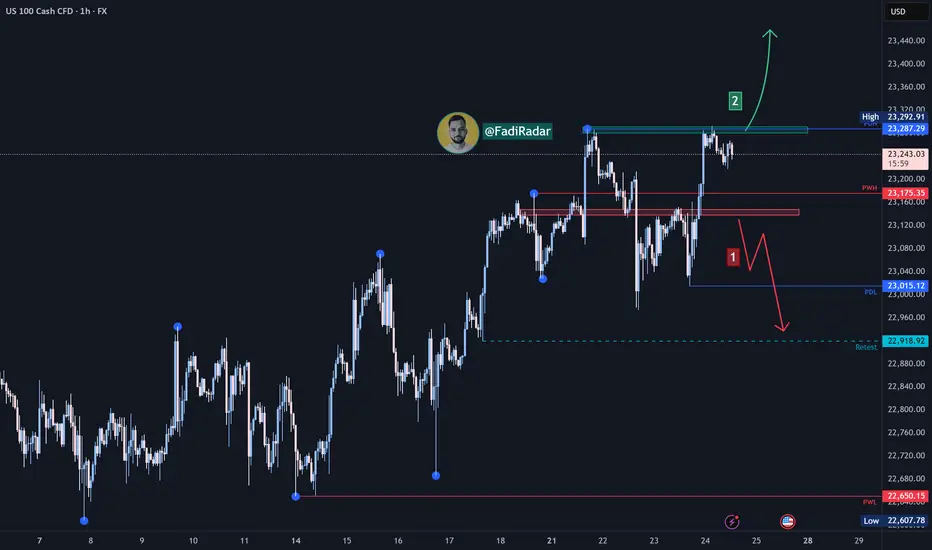
Nasdaq Index Analysis (US100 / NASDAQ):The Nasdaq index continues its upward trend in the medium to long term. Yesterday, it tested the 23,000 USD level and bounced higher toward 23,290 USD.
1️⃣ If the price breaks below 23,100 USD and closes beneath it, we may see a decline toward 23,000 USD, followed by 22,920 USD.
2️⃣ However, if the price holds above 23,290 USD, further bullish momentum could lead to a new high around 23,400 USD.
⚠️ Disclaimer:
This analysis is not financial advice. Please monitor the markets and analyze the data carefully before making any investment decisions.
NDQUSD trade ideas
Will USTEC Continue Its Rallies Amid Better Market Sentiment?Macro approach:
- USTEC advanced modestly this week, supported by upbeat corporate earnings and resilience in economic data amid ongoing policy uncertainty.
- The index benefited from strong expected results in major tech firms such as Microsoft (MSFT) and Nvidia (NVDA), as top giant AI leadership, helping to bolster sentiment despite lingering concerns about tariffs and Fed policy direction.
- US macro data showed sticky inflation in key categories, robust retail sales, and falling jobless claims. This prompted the Fed to retain its cautious stance on rate cuts while markets reassessed policy expectations. Policy-related headlines and manufacturing sector developments also partly drove market volatility.
- USTEC could remain sensitive to incoming tech earnings, the 29-30 Jul Fed meeting, and potential US tariff announcements in early Aug. Persistent inflation and any surprises in central bank communication may drive volatility in the sessions ahead.
Technical approach:
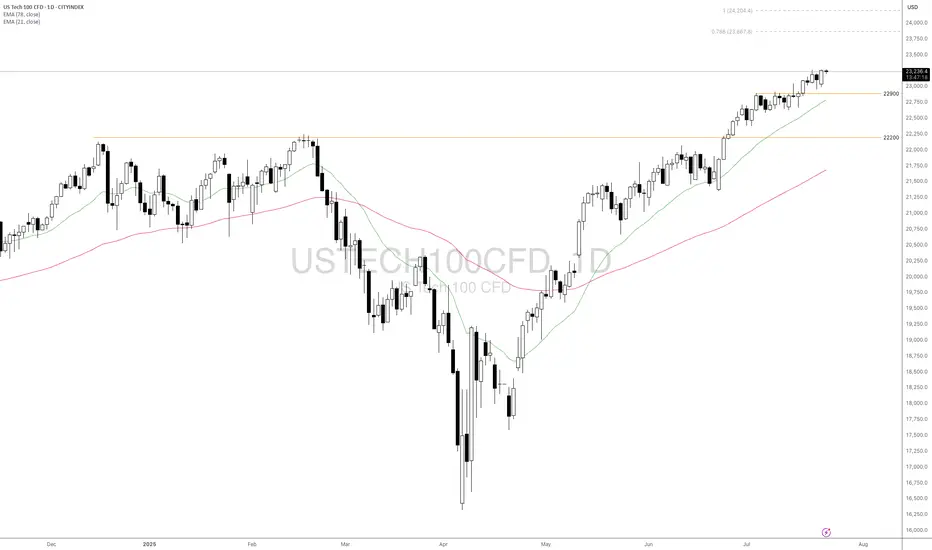
- USTEC trended higher and created a new record high. The price is above both EMAs, indicating a strong bullish momentum.
- If USTEC stays above the support at 22900, the price may continue toward the 78.6% Fibonacci Extension at around 23867.
- On the contrary, breaking below the support at 22900 and EMA21 may prompt a deeper correction to retest the following support at 22000.
Analysis by: Dat Tong, Senior Financial Markets Strategist at Exness
Here’s a fresh Nasdaq100 analysis I’ve put together for you.Hey Guys,
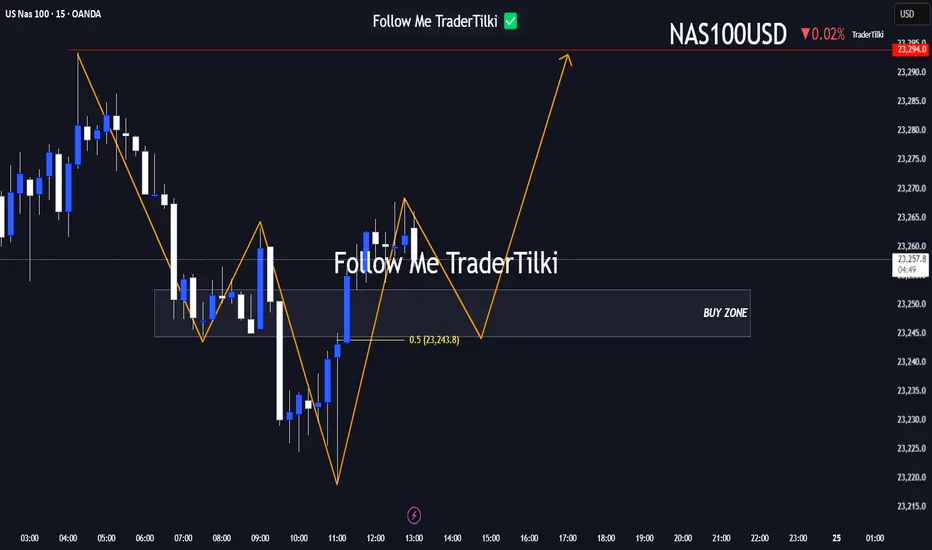
Here’s a fresh Nasdaq100 analysis I’ve put together for you.
I’ve marked the buy zone between 23,252 and 23,240. If price dips into that range, I’m anticipating a potential move upward toward 23,294.
Your likes and support are my biggest source of motivation to keep sharing these insights.
Huge thanks to everyone backing me with a thumbs-up!
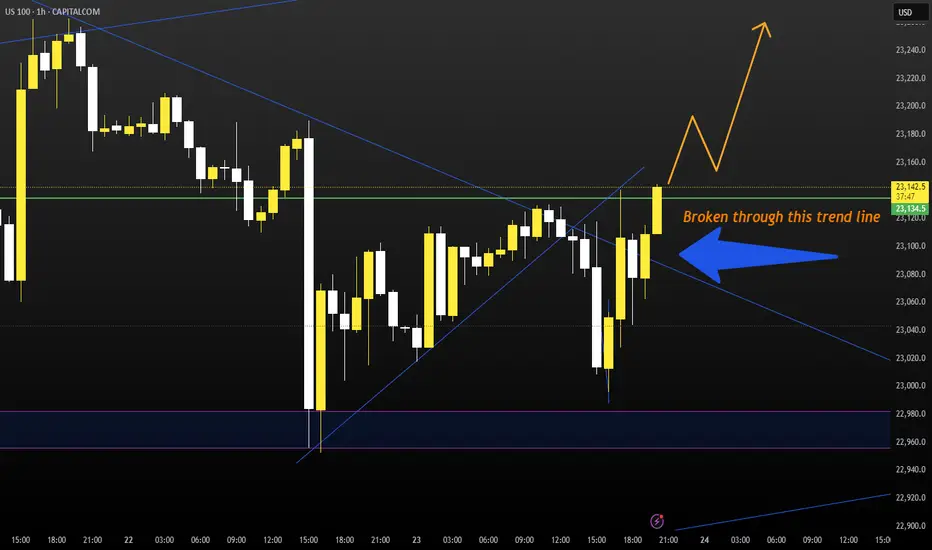
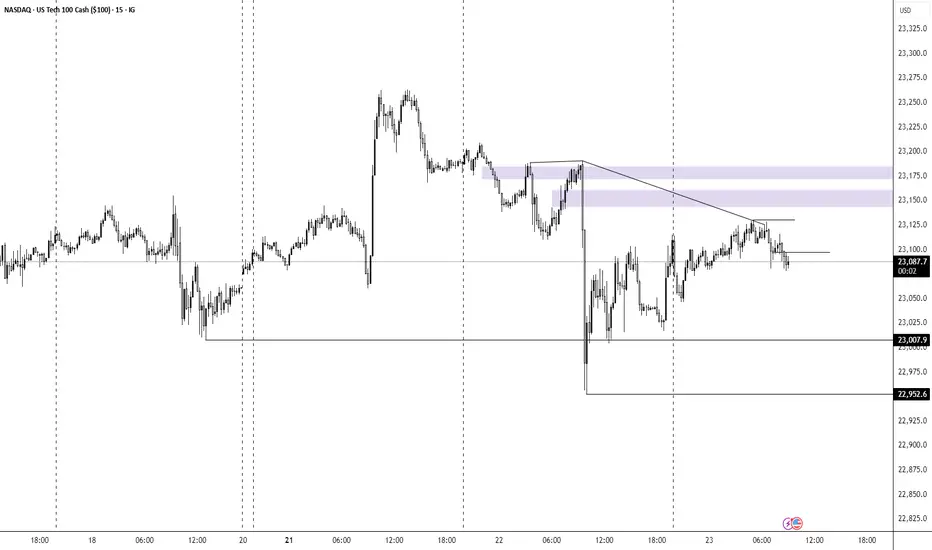
NAS100 Bigger Picture. Uptrend to be resumedLooking at the current structure through the lens of a trend trading approach, what we saw on NAS100 is more than a simple price bounce, it’s a trend continuation trading within a high-volatility environment. As price is approaching a key resistance level, how price is behaving around this dynamic trendline will be key.
This recent retracement and rejection happening near what we can call a demand zone cluster, was confirmed by a beautiful bounce off the support range. And right now price is respecting the upper and lower bounds nicely.
What happens next? Price is showing signs of bullish exhaustion, but the higher-timeframe structure supports a continuation.
My projected target is towards the upper resistance line, that’s my 23,100 zone as shown.

SellRejection Level
Daily Volume
Market Structure Shift
London Session
Trend Line Break
Untapped Order Point
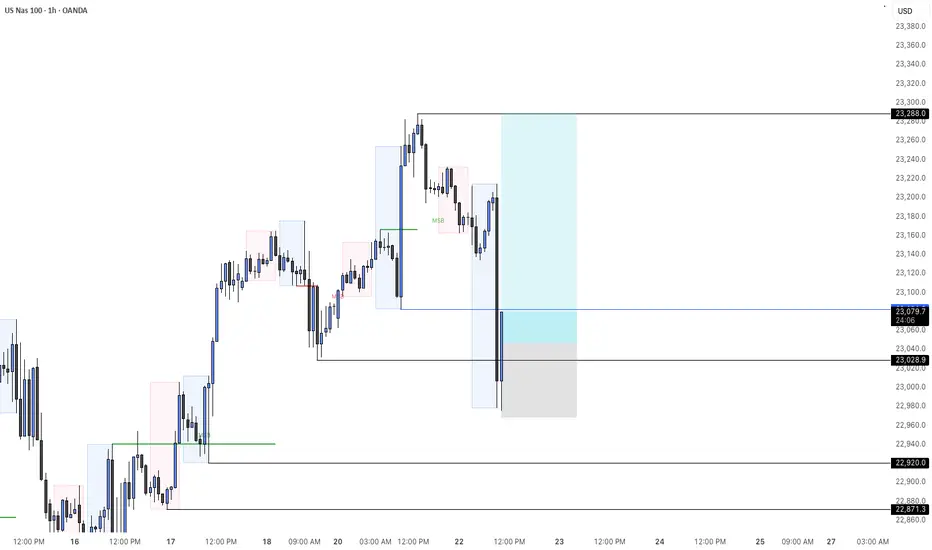
Nasdaq Ascending Trend has been broken.Good night traders.
With Tuesday & today's move. NQ has broken the ascending trend, and retested the highs.
A total of 107 daily candles, 7,000pips move.
Reasons for taking this trade:
Current monthly candle has 2.9m volume, compared to a 6m & 7million from last 2 months. With only 8 days missing to end the month, how to fill all that pending volume?
Ascending trend has been broken and retested.
Expect a deep correction, around 2000-2400-2600 pips. There is correlation between 38.2 Fibo level.
Last week there was a manipulation with Powell dismiss rumor on Wednesday, next day on Thursday NQ rallied to the upside. Today being also Wednesday we saw a huge rejection to the upside, but there is no continuation.
DXY reaching bottom, + has a deeper short trend initiation, starting on January 13.
Trade will be validated if NQ creates a LL followed by a LH within the next 2 days.
What do you think of this analysis?
Thank you.
Enjoy

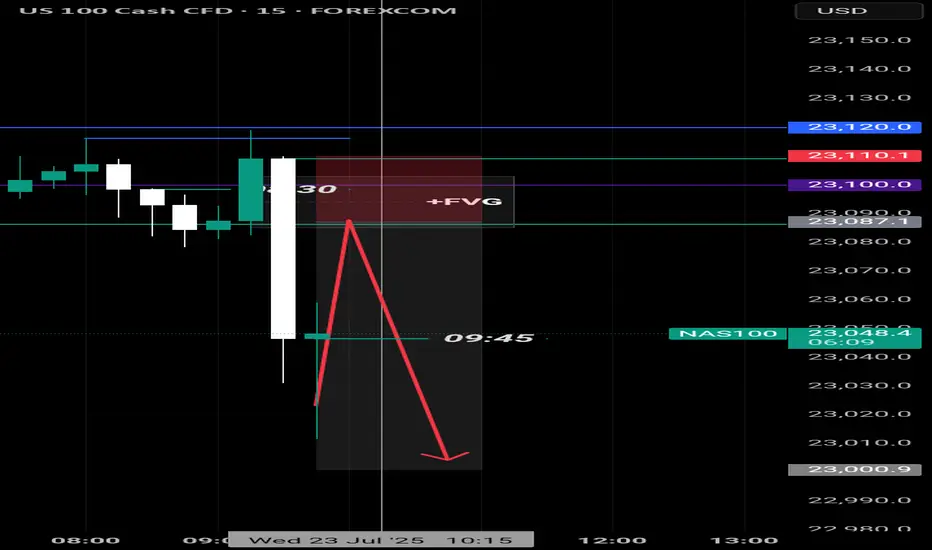
NASDAQ100| - Bullish Bias RemainsPrice didn’t give me the deep candle retrace into my 30M OB — just a wick tap — but that was enough. That wick shows me smart money touched in.
Dropped to the LTF and got my shift in structure confirming bullish intent.
Now I’m locked in, watching for price to sweep a 5M sell-side liquidity pocket into a clean LTF order block for the next entry.
🎯 Target: Short-term 5M highs
🚀 Bias: Still bullish unless structure breaks
This is a patience game now — execution only after confirmation.

NASDAQ (CASH100) SHORT - Head and shoulders H1Risk/reward = 3.8
Entry price = 23 167.9
Stop loss price = 23 232.8
Take profit level 1 (50%) = 22 943
Take profit level 2 (50%) = 22 878
Still waiting on confirmation on some variables in checklist

long position on nas100I am long on nas100 ,I go in detail on the video hope I'm clear ,if you have a question or correction I am open to adjust thank you

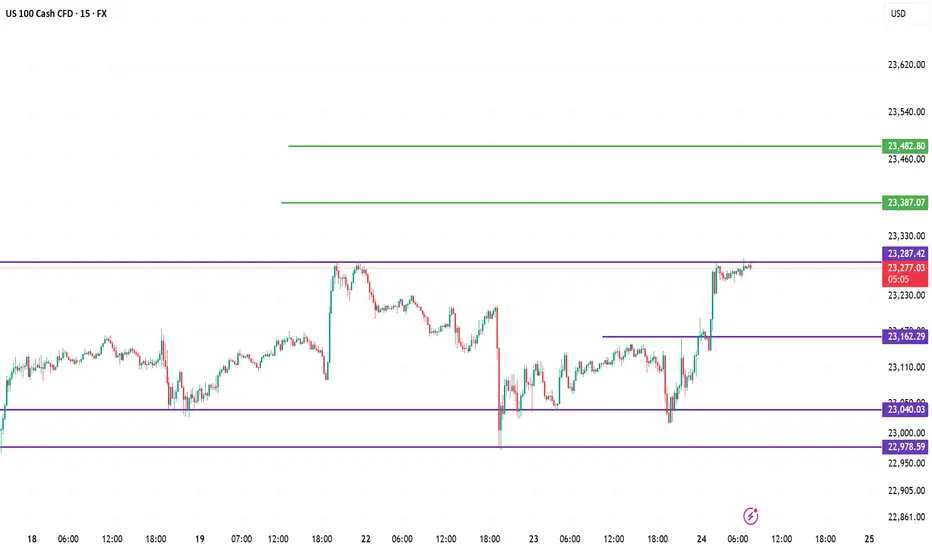
US100 Analysis Report (15m Chart)1. 🔍 Liquidity Grab (Sell-side taken)
Price swept below 23,040 and sharply reversed from 22,978, clearing out weak sellers.
2. 📈 Break of Structure (BOS)
A bullish BOS occurred after price broke above 23,162, confirming short-term bullish intent.
3. 🟪 Rejection Zone
Price is now testing 23,287.42 — a supply/resistance zone. Watch for signs of rejection or breakout.
4. 📊 Bullish Scenario
If price breaks 23,287 cleanly, expect next moves towards 23,387 and then 23,482.
5. 📉 Bearish Setup Possibility
Rejection from 23,287 could pull price back to 23,162 or 23,040 before the next move.

shortsif this short don't hit il be looking to resell at 23270, for now seling to 22485 ,if this short works out il be selling till 20 149

NSDQ100 another bullish flag developing ?Donald Trump has agreed a new trade deal with Japan, setting 15% tariffs on US imports like cars and launching a $550 billion fund to boost investment in the US. This is lower than his earlier 25% tariff threat. Other allies saw mixed outcomes—the Philippines got a small tariff cut, while Canada’s talks stalled. Goldman Sachs now expects the US baseline tariff rate to rise to 15%.
Trump also suggested that Fed Chair Jerome Powell may not stay in his role much longer, and he’s considering removing capital gains tax on home sales, which could affect the housing market.
Separately, a Chinese-linked cyberattack breached the US nuclear weapons agency, though no classified data was stolen. Meanwhile, SpaceX’s investor documents flagged Elon Musk’s political activity as a potential risk as the company targets a $400 billion valuation.
Conclusion for Nasdaq 100:
The Nasdaq 100 faces short-term uncertainty due to rising trade tariffs, Fed leadership questions, and geopolitical risks. While some US-focused investments could benefit, traders should stay cautious as policy and global tensions evolve.
Key Support and Resistance Levels
Resistance Level 1: 23265
Resistance Level 2: 23670
Resistance Level 3: 23480
Support Level 1: 22953
Support Level 2: 22840
Support Level 3: 22740
This communication is for informational purposes only and should not be viewed as any form of recommendation as to a particular course of action or as investment advice. It is not intended as an offer or solicitation for the purchase or sale of any financial instrument or as an official confirmation of any transaction. Opinions, estimates and assumptions expressed herein are made as of the date of this communication and are subject to change without notice. This communication has been prepared based upon information, including market prices, data and other information, believed to be reliable; however, Trade Nation does not warrant its completeness or accuracy. All market prices and market data contained in or attached to this communication are indicative and subject to change without notice.

USNAS100 Eyes 23350 Ahead of Powell & Earnings StormUSNAS100
The price maintains bullish momentum, as outlined in the previous idea, with a clean rejection from the 23280 zone. Today, volatility is expected to increase ahead of Jerome Powell’s speech and a wave of key earnings reports.
As long as price holds above 23140, the outlook remains bullish toward 23230 and 23350.
A short-term correction toward 23045 is possible if we get a 1H close below 23140.
Resistance: 23230 · 23350 · 23510
Support: 23045 · 22920

Nasdaq Index (US100 / NASDAQ):The Nasdaq index continues to move in a medium- to long-term uptrend, recently testing the 23,000 support zone and bouncing upward.
🔹 Bearish Scenario:
If the price breaks and closes below 23,000, it may lead to a decline toward 22,920, followed by a deeper move toward 22,650.
🔹 Bullish Scenario:
If the price holds above 23,200, further upside toward a new high around 23,400 is likely.
⚠️ Disclaimer:
This analysis is for educational purposes only and does not constitute financial advice. Always monitor the markets and perform your own due diligence before making any investment decisions.

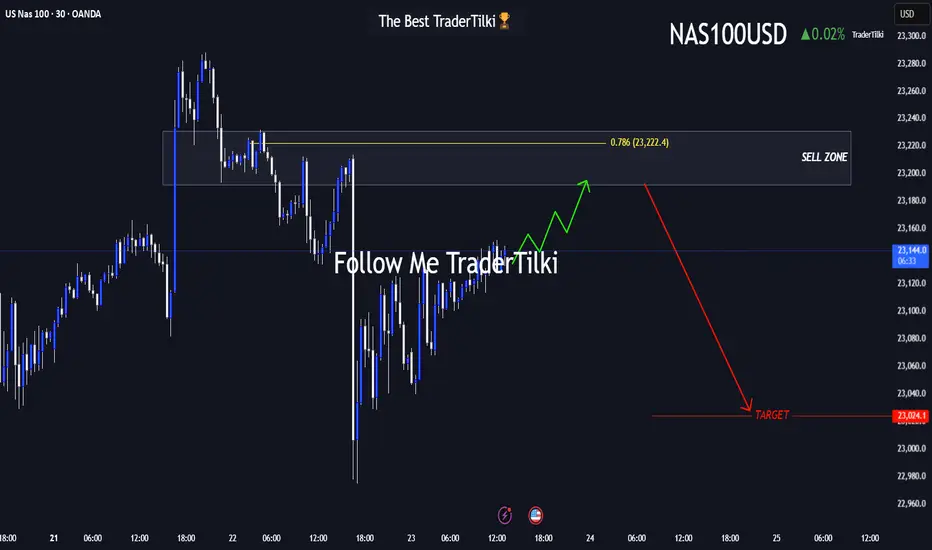
The US100-Nasdaq Playbook: Prime Sell Zone Approaching!Hey friends 👋
I’ve prepared a fresh US100-NASDAQ analysis for you all. Nothing makes me happier than seeing us grow and profit together.
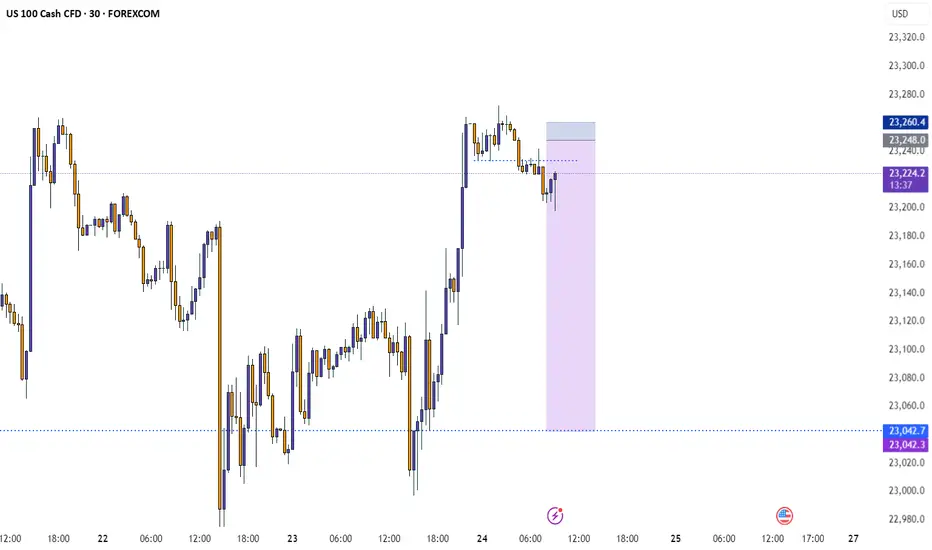
📌 Once price reaches the 23,192 – 23,231 zone, I plan to enter a **Sell** trade from that area.
🔐 Feel free to set your stop-loss based on your personal margin and risk tolerance.
🎯 My target level is: **23,024**
Every single like from you means the world to me—it’s my biggest motivation to keep sharing high-quality analysis 🙏
Huge thanks to everyone who supports with their likes 💙
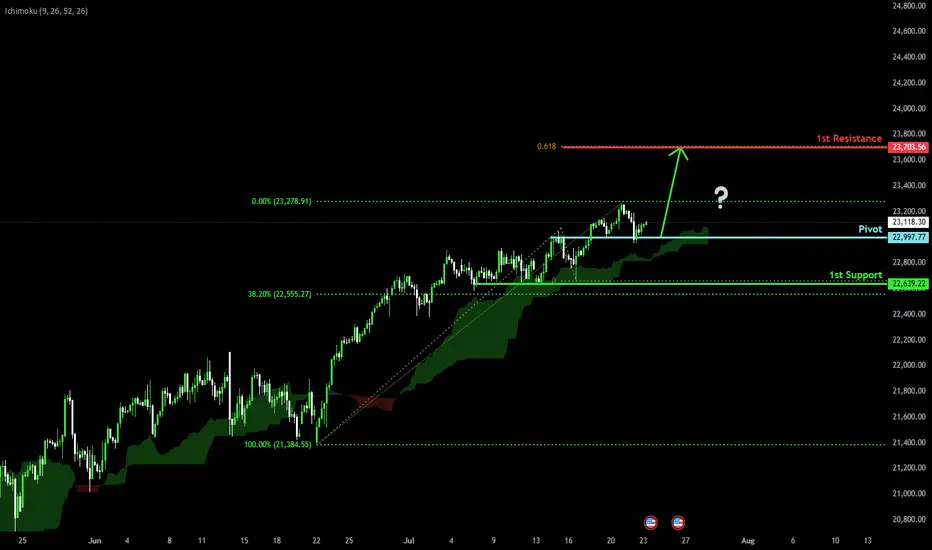
Bullish continuation?USTEC has bounced off the pivot, which has been identified as an overlap support, and could rise to the 1st resistance.
Pivot: 22,997.77
1st Support: 22,639.22
1st Resistance: 23,703.56
Risk Warning:
Trading Forex and CFDs carries a high level of risk to your capital and you should only trade with money you can afford to lose. Trading Forex and CFDs may not be suitable for all investors, so please ensure that you fully understand the risks involved and seek independent advice if necessary.
Disclaimer:
The above opinions given constitute general market commentary, and do not constitute the opinion or advice of IC Markets or any form of personal or investment advice.
Any opinions, news, research, analyses, prices, other information, or links to third-party sites contained on this website are provided on an "as-is" basis, are intended only to be informative, is not an advice nor a recommendation, nor research, or a record of our trading prices, or an offer of, or solicitation for a transaction in any financial instrument and thus should not be treated as such. The information provided does not involve any specific investment objectives, financial situation and needs of any specific person who may receive it. Please be aware, that past performance is not a reliable indicator of future performance and/or results. Past Performance or Forward-looking scenarios based upon the reasonable beliefs of the third-party provider are not a guarantee of future performance. Actual results may differ materially from those anticipated in forward-looking or past performance statements. IC Markets makes no representation or warranty and assumes no liability as to the accuracy or completeness of the information provided, nor any loss arising from any investment based on a recommendation, forecast or any information supplied by any third-party.
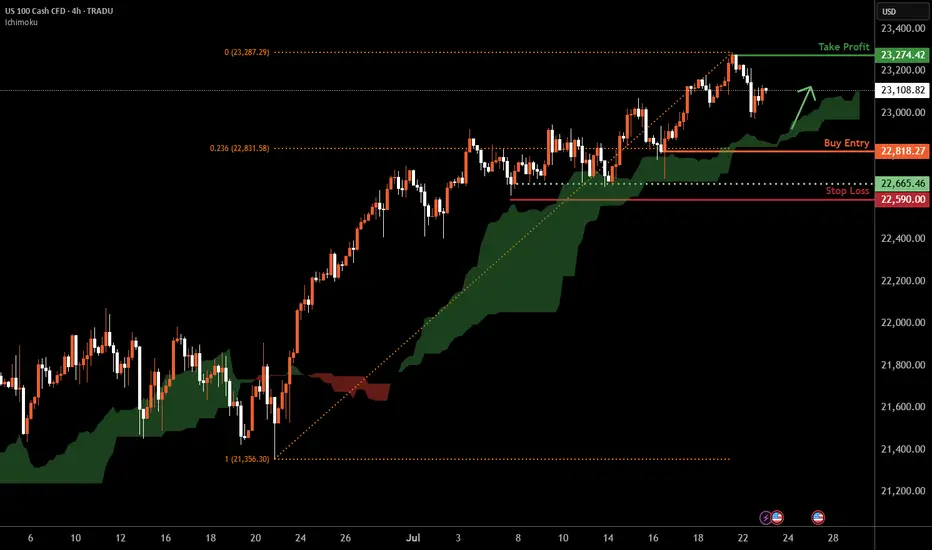
Nasdaq-100 H4 | Bullish uptrend to extend higher?The Nasdaq-100 (NAS100) is falling towards a swing-low support and could potentially bounce off this level to climb higher.
Buy entry is at 22,818.27 which is a swing-low support that aligns with the 23.6% Fibonacci retracement.
Stop loss is at 22,590.00 which is a level that lies underneath a multi-swing-low support.
Take profit is at 23,274.42 which is a swing-high resistance.
High Risk Investment Warning
Trading Forex/CFDs on margin carries a high level of risk and may not be suitable for all investors. Leverage can work against you.
Stratos Markets Limited (tradu.com ):
CFDs are complex instruments and come with a high risk of losing money rapidly due to leverage. 66% of retail investor accounts lose money when trading CFDs with this provider. You should consider whether you understand how CFDs work and whether you can afford to take the high risk of losing your money.
Stratos Europe Ltd (tradu.com ):
CFDs are complex instruments and come with a high risk of losing money rapidly due to leverage. 66% of retail investor accounts lose money when trading CFDs with this provider. You should consider whether you understand how CFDs work and whether you can afford to take the high risk of losing your money.
Stratos Global LLC (tradu.com ):
Losses can exceed deposits.
Please be advised that the information presented on TradingView is provided to Tradu (‘Company’, ‘we’) by a third-party provider (‘TFA Global Pte Ltd’). Please be reminded that you are solely responsible for the trading decisions on your account. There is a very high degree of risk involved in trading. Any information and/or content is intended entirely for research, educational and informational purposes only and does not constitute investment or consultation advice or investment strategy. The information is not tailored to the investment needs of any specific person and therefore does not involve a consideration of any of the investment objectives, financial situation or needs of any viewer that may receive it. Kindly also note that past performance is not a reliable indicator of future results. Actual results may differ materially from those anticipated in forward-looking or past performance statements. We assume no liability as to the accuracy or completeness of any of the information and/or content provided herein and the Company cannot be held responsible for any omission, mistake nor for any loss or damage including without limitation to any loss of profit which may arise from reliance on any information supplied by TFA Global Pte Ltd.
The speaker(s) is neither an employee, agent nor representative of Tradu and is therefore acting independently. The opinions given are their own, constitute general market commentary, and do not constitute the opinion or advice of Tradu or any form of personal or investment advice. Tradu neither endorses nor guarantees offerings of third-party speakers, nor is Tradu responsible for the content, veracity or opinions of third-party speakers, presenters or participants.
NASDAQ | BearishNASDAQ has Printed double top as well as broken the bullish trend by printing two lower highs and lower lows.It is likely to continue the bearish trend since NASDAQ has already witnessed quite a long bullish rally.
