NASDAQ100 continue its strength due to the strong earning seasonFundamental:
USTEC (NASDAQ100) continues its strength, propelled by robust Alphabet (GOOG) earnings that buoyed technology companies. Cloud services recorded the largest growth at 32% YoY, primarily driven by AI. Concurrently, the company plans to allocate $85 bln to capital expenditure in 2025 for AI, an increase from $75 bln, signaling continued surging demand for AI infrastructure.
In addition, recent US economic data indicated strong consumption and optimism, with the July Services PMI expanding to 55.2 from 52.9 in the previous month. Initial Jobless Claims also fell to 217k, the lowest in 14 weeks, reinforcing optimism regarding the labor market, alongside stronger-than-expected Nonfarm Payrolls from early July.
Inflation data showed a minor impact from tariffs, and tariff negotiations have progressed favorably. Trade deals have been secured with Vietnam, Indonesia, Japan, and the Philippines, and potential trade agreements with the Eurozone and India are anticipated before the deadline.
Major earnings releases are slated for next week, including MSFT, META, and QCOM on July 30. AMZN and APPL's results the following day could provide a clearer picture of USTEC's overall earnings.
Meanwhile, USTEC's forward P/E currently stands at 27x, aligning with its 5-year average despite reaching a new record high, suggesting further upside potential.
Technical:
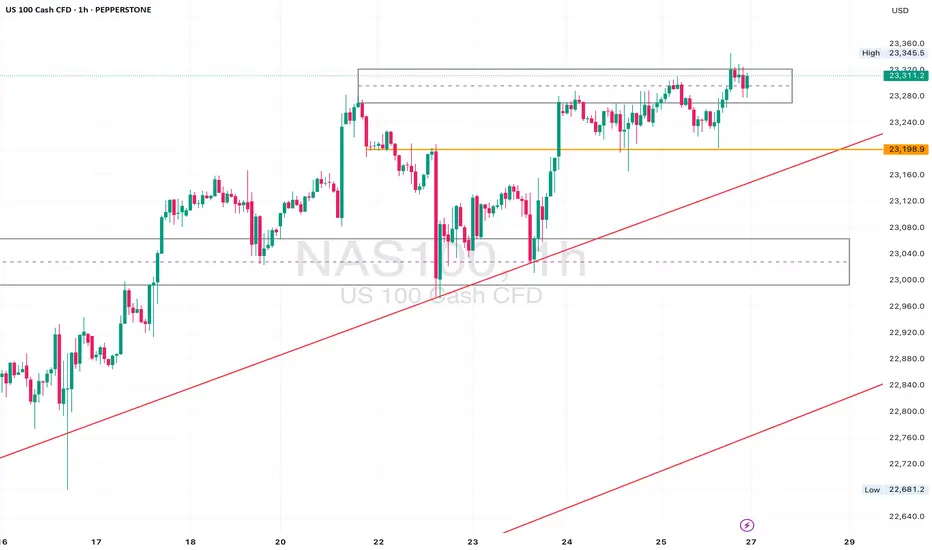
The index is trading above its EMAs, which are extending, signaling a continuation of the rally.
If USTEC sustains its momentum, the index may reach 24000 upon breaking above the potential resistance at 23400.
Conversely, a pullback near the swing high may suggest a retest of the support at 23000.
NQCUSD trade ideas

NASDAQ Bulls Pushing – Will 20,347 Hold or Break?Price is currently approaching the 20,347 🔼 resistance zone after a strong bullish rally from the 19,150 🔽 support level. The market structure remains bullish with consistent higher highs and higher lows, showing strong buyer momentum.
Support at: 19,670 🔽, 19,150 🔽, 18,500 🔽, 17,600 🔽
Resistance at: 20,347 🔼, 20,600 🔼, 21,000 🔼
Bias:
🔼 Bullish: If price breaks and holds above 20,347 🔼, we could see a continuation toward 20,600 and 21,000.
🔽 Bearish: A strong rejection from 20,347 🔼 could send price back down toward 19,670 and 19,150 for a retest.
📛 Disclaimer: This is not financial advice. Trade at your own risk.

NAS100 Retesting Breakout – Eyes on 23170 for Bullish PushDaily Analysis:
Price is testing the upper boundary of the long-term ascending channel. Structure is still bullish with no major breaks of support. If momentum holds, we could extend toward the channel top.
4H Analysis:
Retesting breakout structure. Support is forming around 23000–23050. Bullish momentum remains valid unless price closes below this zone.
1H Analysis:
Micro-breakout confirmed with bullish impulse above 23120. If 23170 holds, continuation toward 23280–23320 is likely.
Confirmation & Entry:
Watch for continuation above 23170. SL below 23080. TP: 23280+
Use caution if 23000 breaks — this would weaken short-term bias.
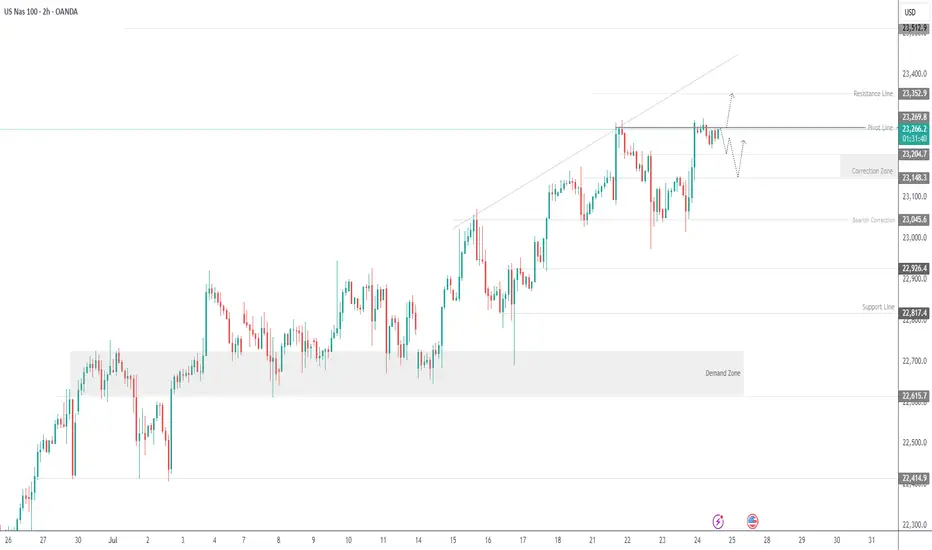
Here’s a fresh Nasdaq100 analysis I’ve put together for you.Hey Guys,
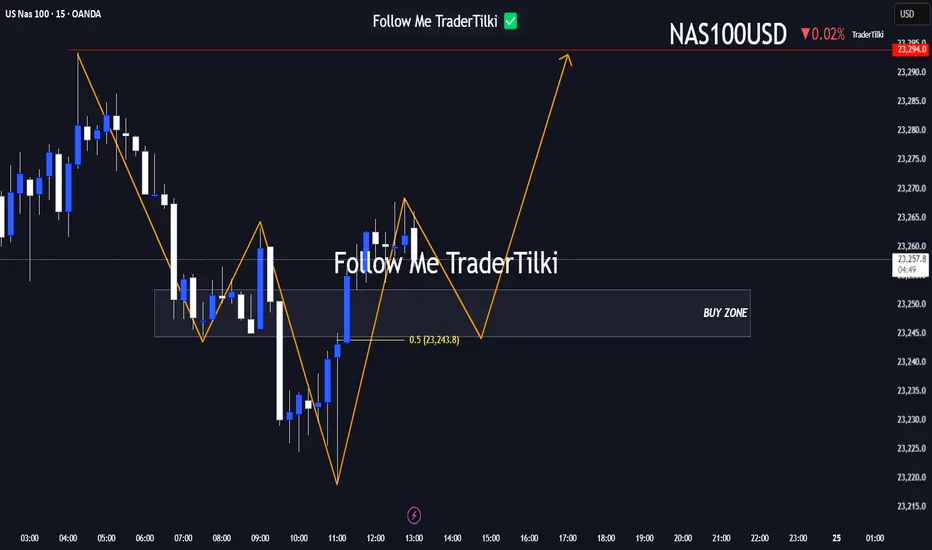
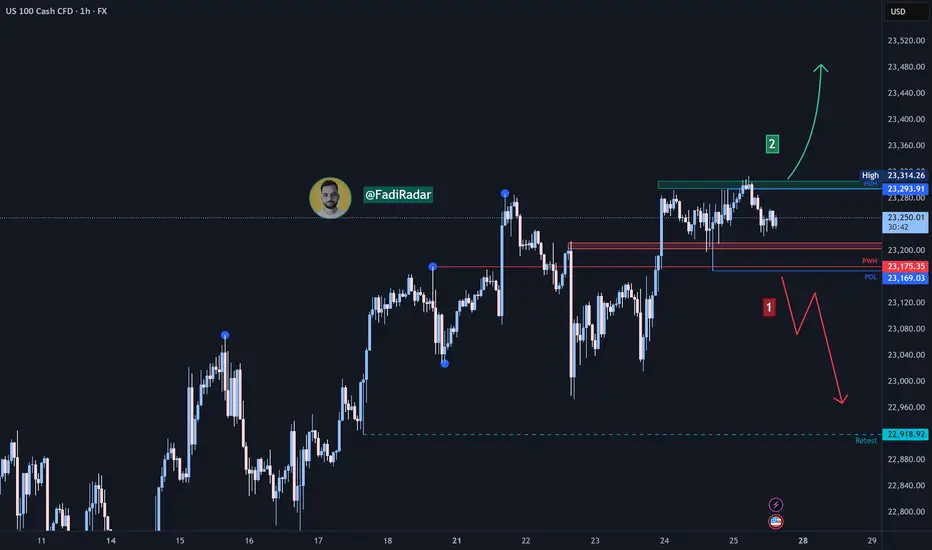
Here’s a fresh Nasdaq100 analysis I’ve put together for you.
I’ve marked the buy zone between 23,252 and 23,240. If price dips into that range, I’m anticipating a potential move upward toward 23,294.
Your likes and support are my biggest source of motivation to keep sharing these insights.
Huge thanks to everyone backing me with a thumbs-up!
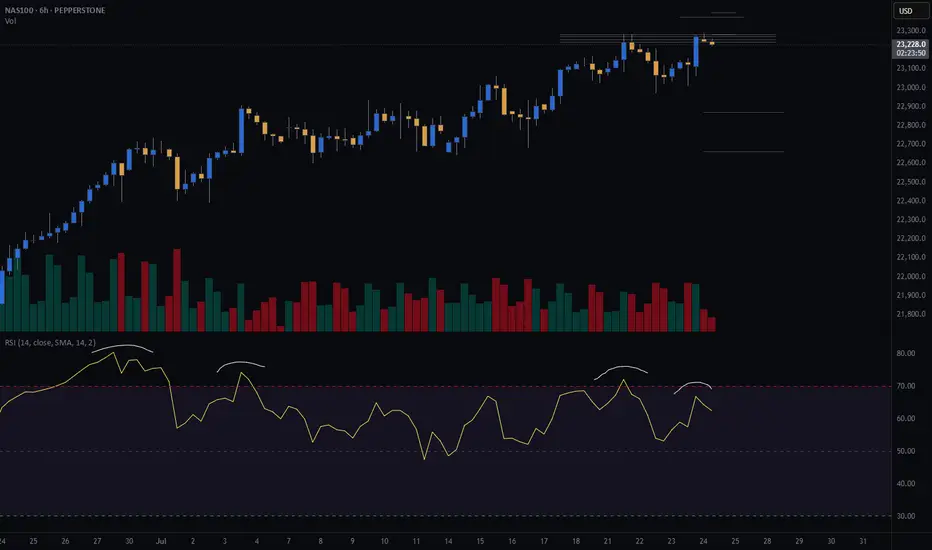
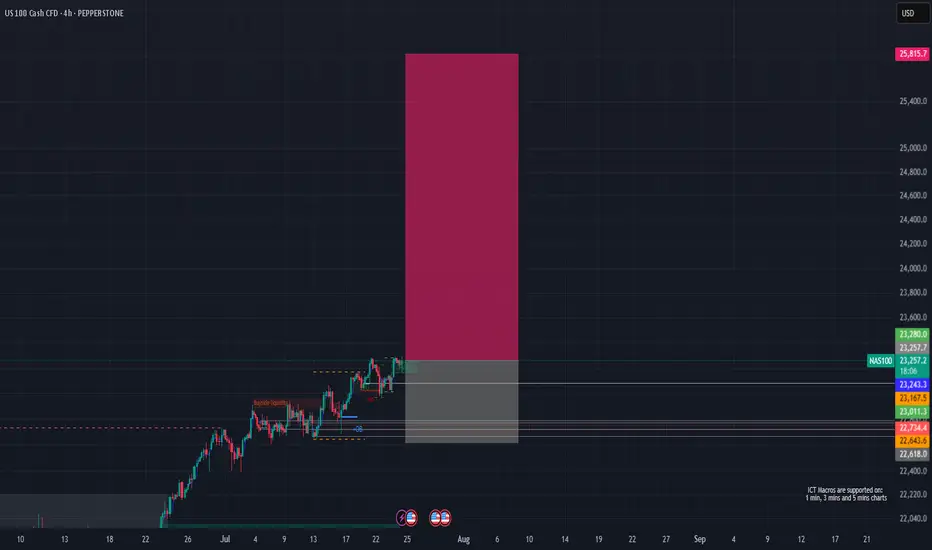
Upward momentum of Nasdaq is weakening, likely to fall to supporUpward momentum of Nasdaq is weakening, likely to fall to support level of 22k

NASDAQ (CASH100) SHORT - Head and shoulders H1Risk/reward = 3.8
Entry price = 23 167.9
Stop loss price = 23 232.8
Take profit level 1 (50%) = 22 943
Take profit level 2 (50%) = 22 878
Still waiting on confirmation on some variables in checklist

Us100 short position 24/07/2025English : According to our analysis, we anticipate a bearish scenario.
Morocan Darija : kanchofo d'apres l'analyse dyalna antsanaw hboot
ATENTION : I only share my ideas, not signals
NSDQ100 pushing to new ATH?Thursday was a slightly positive session for equities, with the NASDAQ 100 rising +0.18% to close at a fresh record high, driven by strong economic data. However, overall market action was subdued, with the S&P 500’s trading range the narrowest since February (0.35%).
Notably, the equal-weighted S&P 500 fell -0.33%, highlighting underlying weakness outside mega-cap tech.
A key drag on the NASDAQ came from Tesla (-8.20%), which slumped after disappointing earnings. This weighed on the Magnificent 7, which declined -0.21% despite gains in the other six members.
On the macro front, the US dollar strengthened as Donald Trump downplayed his dispute with Fed Chair Jerome Powell, though continued to pressure the Fed on interest rates. Meanwhile, the FCC approved Paramount’s merger with Skydance, signaling a green light for M&A activity in media despite political tensions.
Conclusion – NASDAQ 100 Trading View:
The NASDAQ 100 remains technically bullish, setting new highs amid resilient economic data. However, breadth is weakening, and headline risk—especially around earnings (e.g., Tesla)—could trigger short-term volatility. Traders should stay long with caution, watching for sector rotation or profit-taking near highs, and monitor Fed-related rhetoric for macro-driven moves.
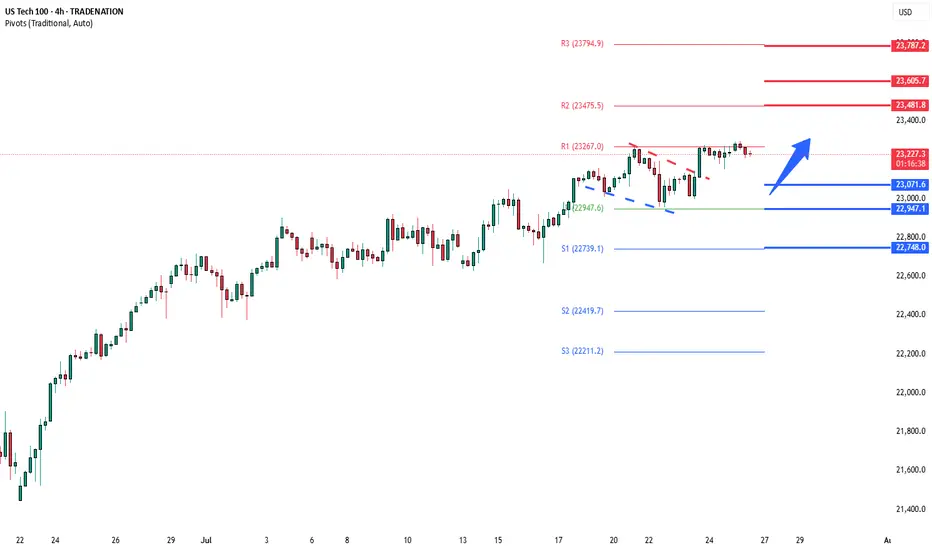
Key Support and Resistance Levels
Resistance Level 1: 23480
Resistance Level 2: 23600
Resistance Level 3: 23790
Support Level 1: 23070
Support Level 2: 22950
Support Level 3: 22750
This communication is for informational purposes only and should not be viewed as any form of recommendation as to a particular course of action or as investment advice. It is not intended as an offer or solicitation for the purchase or sale of any financial instrument or as an official confirmation of any transaction. Opinions, estimates and assumptions expressed herein are made as of the date of this communication and are subject to change without notice. This communication has been prepared based upon information, including market prices, data and other information, believed to be reliable; however, Trade Nation does not warrant its completeness or accuracy. All market prices and market data contained in or attached to this communication are indicative and subject to change without notice.
Nasdaq Index (US100 / NASDAQ) Technical Analysis:The Nasdaq index continues its medium- to long-term uptrend. Yesterday, it tested the 23,170$ level and rebounded upward, reaching 23,310$.
🔹 Bearish Scenario:
If the price breaks and closes below 23,200$, it may decline toward 23,000$, followed by 22,920$.
🔹 Bullish Scenario:
If the price holds above 23,300$, the uptrend is likely to continue toward a new high near 23,400$.
⚠️ Disclaimer:
This analysis is for educational purposes only and does not constitute financial advice. Always monitor the markets and perform your own analysis before making any trading decisions.
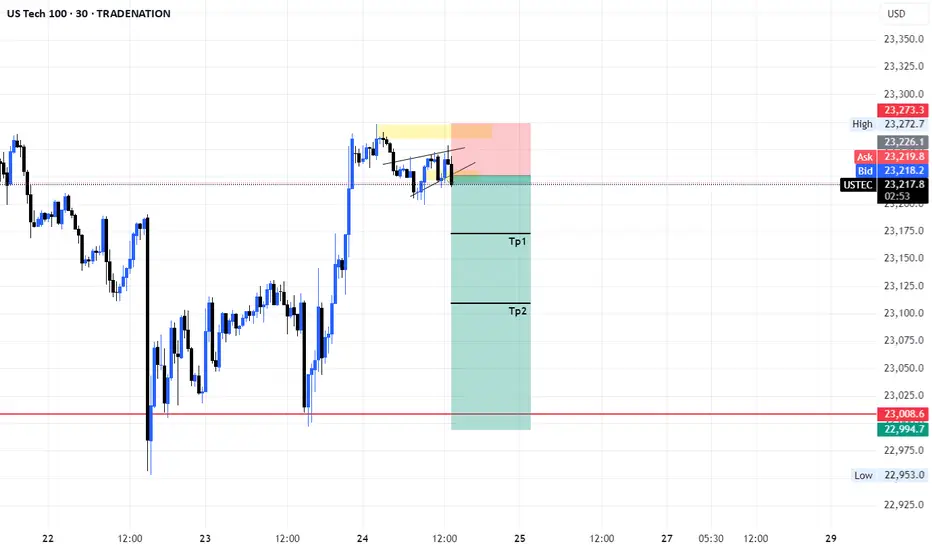
NASDAQ (CASH100) SHORT - double top H6Risk/reward = 4.3
Entry price = 23 282
Stop loss price = 23 398
Take profit level 1 (50%) = 22 871
Take profit level 2 (50%) = 22 663
If current H6 goes back into range, I will open short position.
All variables on checklist have been met.
I was out last night so I missed my initial entry. Hoping for a second chance.
Hopefully this short works because the last few higher time frame short setups have failed, although because of exit plan I have made very little losses.
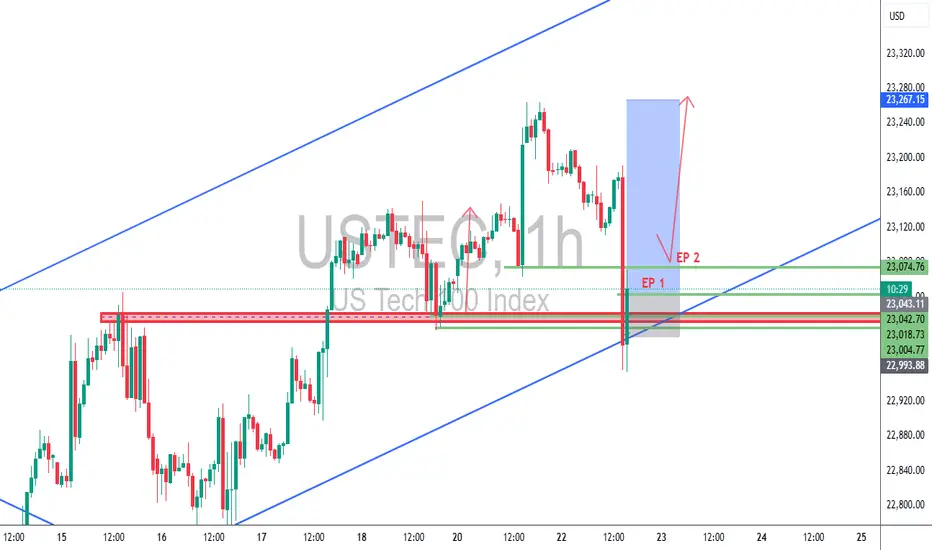
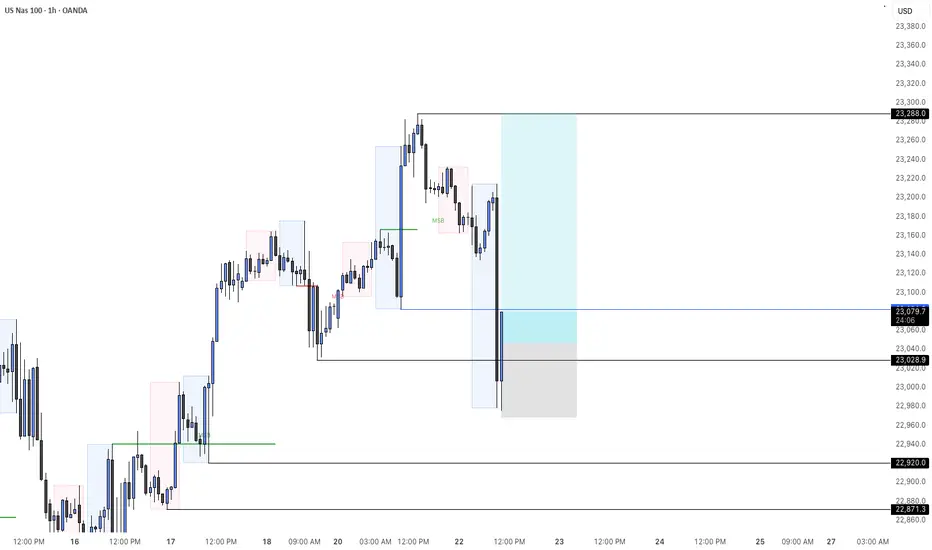
USTEC 1H – Dual Entry Precision | TCB Trend Phase SetupUSTEC 1H – Dual Entry Precision | TCB Trend Phase Setup
Market remained bullish with clear channel structure. After a pullback into the previous breakout zone, price swept liquidity and wicked below, offering two refined entries (EP 1 & EP 2) inside the demand zone.
🔸 EP 1 – Aggressive entry on first touch
🔸 EP 2 – Confirmation entry after rejection
🔸 SL placed below structural liquidity sweep
🔸 Target: Mid-channel + price inefficiency fill above
Trade Summary
🧠 Trend Phase entry with TCB logic
📌 Demand zone = Key structure
⏱️ Low drawdown
💥 RRR ~1:3
📈 TP in motion (or hit, if price reached 23,267)
📎 #Hashtags:
#USTEC #US100 #Nasdaq #SmartMoneyConcepts #SniperTrader #ForexTrading #PriceActionTrading #TCBSetup #TrendTrading #LiquiditySweep #RiskReward #TradingViewAnalysis
shortsif this short don't hit il be looking to resell at 23270, for now seling to 22485 ,if this short works out il be selling till 20 149

Possible direction bias on Nas100FX:NAS100 Now the price is still uptrending and those that think the price is high and want to sell might get their ass wipe. After the break of the current high, I expect a pullback to sweep the LIQ of the low that cause the break and then continue to the upside.
NAS100 (LONG IDEA)🟦 NAS100 (US Tech 100) – LONG SETUP 🟦
📅 Posted: 24 July 2025
🚦 Bias: BULLISH (Long)
🎯 Entry: 23,262 (market) or 23,170–23,250 (limit on dip)
🛑 Stop Loss: 22,617 (HTF structure protection)
🏁 Take Profits:
• TP1: 23,800
• TP2: 24,500
• TP3: 25,800
🔍 Technical Breakdown:
📈 Multi-Timeframe Confluence:
Monthly/Weekly/Daily: All show strong bullish structure, with price making new highs and respecting key demand zones.
4H/1H: Price is consolidating above a Fair Value Gap (FVG) at 23,170–23,250, showing strong demand and absorption.
🟩 FVG Support: 23,170–23,250 is the high-probability dip buy zone, aligning across all timeframes.
🟦 Structure: Higher highs and higher lows, with no signs of exhaustion.
🟢 Momentum: Bullish, with buyers stepping in on every dip.
🛡️ Invalidation: Clean break and close below 22,730 would invalidate the setup.
🔥 Fundamental & Sentiment Context:
💻 Tech/AI Leadership: US tech and AI stocks are driving index strength.
💵 Earnings Momentum: Strong earnings season, macro resilience.
🧑💻 Sentiment: Retail is long but not euphoric; institutions still net buyers.
🌍 Macro: No major headwinds; risk-on flows support further upside.
🛠️ Execution Plan:
💸 Buy now @ 23,262 or scale in on dips to 23,170–23,250 (FVG retest).
🛡️ Stop Loss: 22,617 (structure break).
🎯 Targets:
TP1: 23,800 (first liquidity target)
TP2: 24,500 (extension)
TP3: 25,800 (ATH zone)
⚡ Summary:
All signals GO! 🚦 Multi-timeframe bullish structure, FVG support, and strong momentum. Risk is well-defined below 22,730. Targeting new highs as tech/AI leadership continues.
NAS100 ShortSecond entry same area to enter
Elite Analysis
Price came to structural liquidity
Targeted a 5m OB for execution
TP's targeted at lower liquidity pools

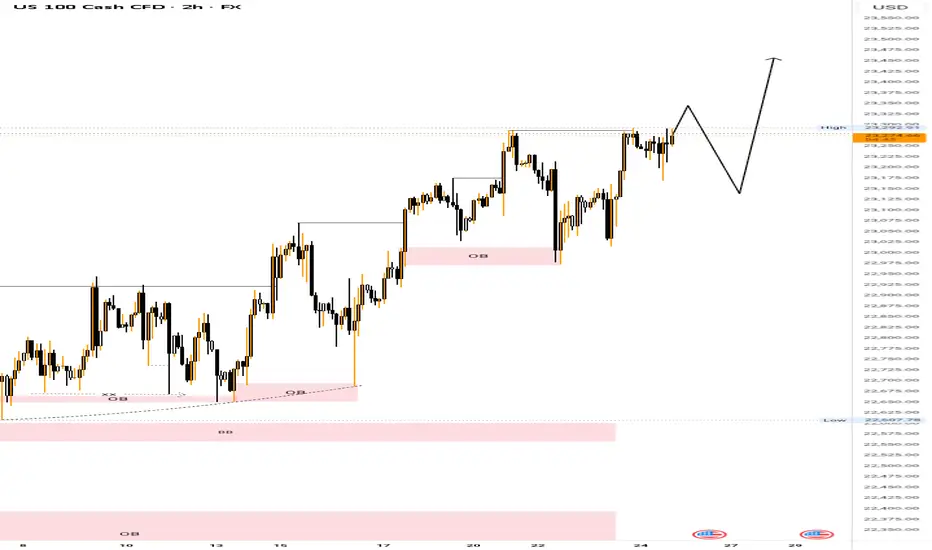
USNAS100 - Tech Index Pulls Back After Testing 23,295USNAS100 | OVERVIEW
The index came close to registering a new ATH at 23,295 before pulling back slightly.
Today, it appears to be in a bearish correction phase toward 23,200 and 23,150, as long as the price trades below 23,270.
Market sentiment may remain cautious, especially with no major earnings reports scheduled before the open, although Intel’s report after the close could have a notable impact.
A 1H close above 23,290 would invalidate the correction and open the way toward 23,350 and 23,500.
Key Levels:
Support: 23,200 · 23,150 · 23,050
Resistance: 23,350 · 23,520
SellRejection Level
Daily Volume
Market Structure Shift
London Session
Trend Line Break
Untapped Order Point
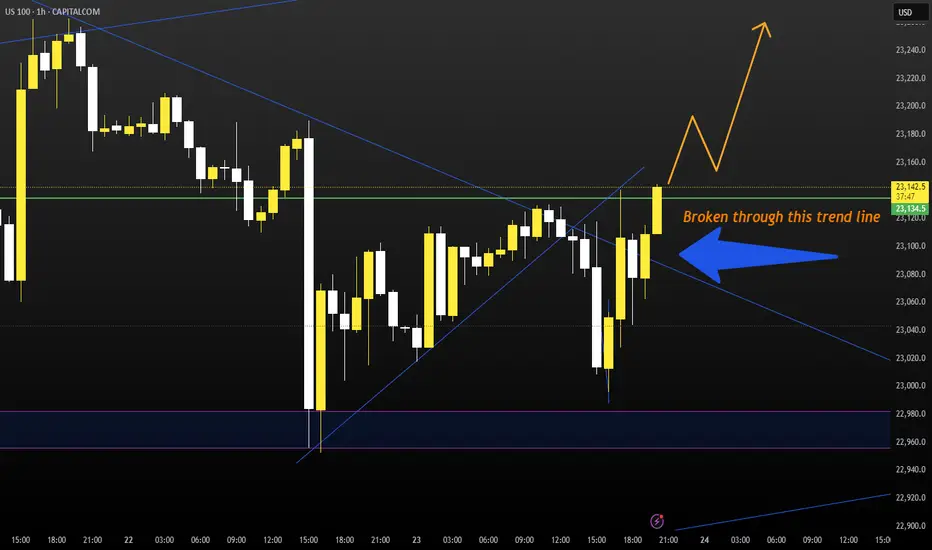
Nasdaq Ascending Trend has been broken.Good night traders.
With Tuesday & today's move. NQ has broken the ascending trend, and retested the highs.
A total of 107 daily candles, 7,000pips move.
Reasons for taking this trade:
Current monthly candle has 2.9m volume, compared to a 6m & 7million from last 2 months. With only 8 days missing to end the month, how to fill all that pending volume?
Ascending trend has been broken and retested.
Expect a deep correction, around 2000-2400-2600 pips. There is correlation between 38.2 Fibo level.
Last week there was a manipulation with Powell dismiss rumor on Wednesday, next day on Thursday NQ rallied to the upside. Today being also Wednesday we saw a huge rejection to the upside, but there is no continuation.
DXY reaching bottom, + has a deeper short trend initiation, starting on January 13.
Trade will be validated if NQ creates a LL followed by a LH within the next 2 days.
What do you think of this analysis?
Thank you.
Enjoy

NASDAQ | BearishNASDAQ has Printed double top as well as broken the bullish trend by printing two lower highs and lower lows.It is likely to continue the bearish trend since NASDAQ has already witnessed quite a long bullish rally.

Nasdaq Index (US100 / NASDAQ):The Nasdaq index continues to move in a medium- to long-term uptrend, recently testing the 23,000 support zone and bouncing upward.
🔹 Bearish Scenario:
If the price breaks and closes below 23,000, it may lead to a decline toward 22,920, followed by a deeper move toward 22,650.
🔹 Bullish Scenario:
If the price holds above 23,200, further upside toward a new high around 23,400 is likely.
⚠️ Disclaimer:
This analysis is for educational purposes only and does not constitute financial advice. Always monitor the markets and perform your own due diligence before making any investment decisions.

NasdaqCOT data shows large speculators increasing net long positions on the Nasdaq-100, reflecting rising institutional confidence in tech and growth sectors. This positioning supports a bullish bias, especially as price holds above key moving averages and market breadth improves.
