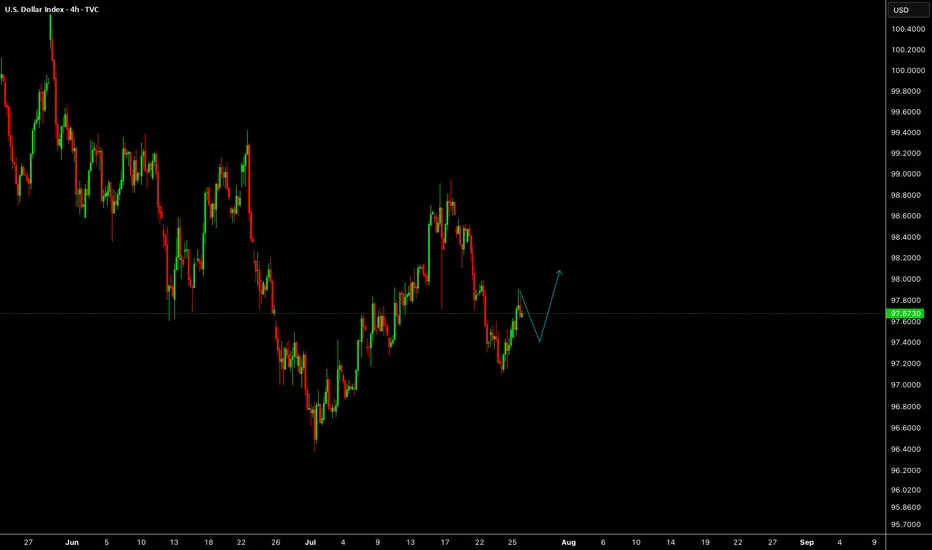
DXYDXY needs some more correction, if the correction is completed before Feds decision then a drop can follow otherwise Feds will push it up and NFP will drop it again.
Disclosure: We are part of Trade Nation's Influencer program and receive a monthly fee for using their TradingView charts in our analysis.
USXUSD trade ideas
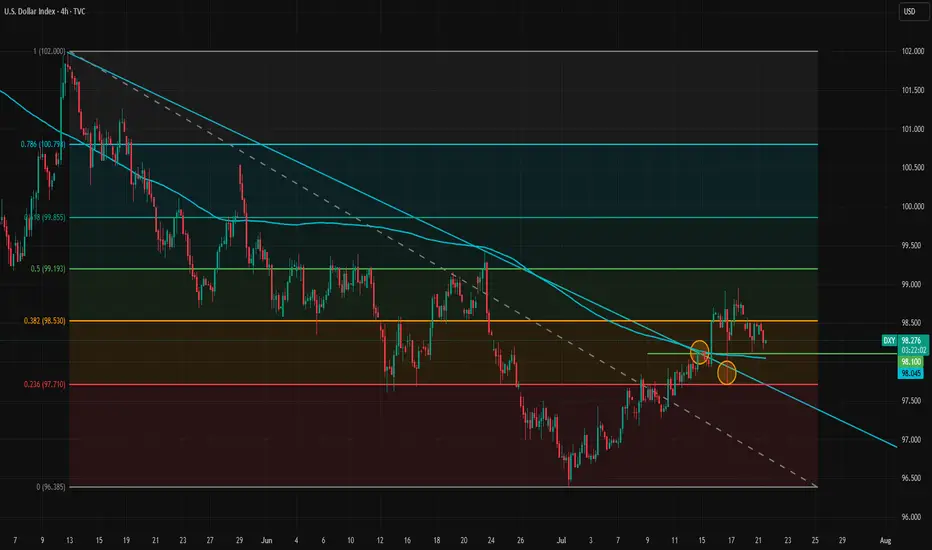
Fundamentals Support Dollar’s Potential Trend ReversalThe dollar appears to be reversing its direction on the 4-hour timeframe. The trendline has been broken and retested twice, but the dollar has held above it, signaling a potential shift in momentum.
Despite intense pressure from the White House on the Federal Reserve, the data is likely to prevent the Fed from cutting rates at the upcoming meeting and possibly at the one after that. A potential rate cut in September will largely depend on incoming inflation and labor market data.
The inflation impact of tariffs became more visible in the latest CPI report, but the effect is still relatively modest. This aligns with our theory that tariff-driven inflation will build gradually and persist over a longer period, rather than cause an immediate spike.
Meanwhile, the labor market has not shown clear signs of rapid weakening, so there is no strong case for a rate cut from that side either. The Financial Conditions Index also indicates that monetary policy remains on the accommodative side. Bloomberg financial conditions index is at highest level since March.
As markets increasingly recognize that no rate cuts are likely in the near term, and with the August 1 tariff deadline approaching amid potential rising risks of trade tensions between the U.S. and the EU, the dollar may gain further support. The U.S.–EU bond market spread also does not favor a stronger euro at the moment, adding to the dollar's upside potential.
In the short term, 98.10 and 98.53 are immediate support and resistance levels. If the dollar breaks above 98.53 again, upward momentum may strengthen and open the path toward the 100 level.
DOLLAR INDEX DXYThe latest U.S. economic data released on July 30, 2025 shows:
ADP Non-Farm Employment Change: Actual increase of 104,000 jobs, significantly above the forecast of 77,000. This marks a strong rebound from the previous decline of -23,000 in June and indicates solid labor market momentum, particularly in services sectors like leisure/hospitality, financial activities, and trade/transportation. However, education and health services saw job losses. Wage growth remains steady at 4.4% year-over-year for job-stayers.
Advance GDP q/q Growth: Actual growth came in at 3.0%, beating the forecast of 2.5% and improving sharply from -0.5% previously. This suggests that the economy is expanding robustly in the second quarter
Advance GDP Price Index q/q (Inflation measure): Actual was 2.0%, slightly below the forecast of 2.2%, and down from 3.8% previously, indicating easing inflation pressures .
Interpretation of this data for Federal Reserve policy:
The stronger-than-expected job growth and GDP expansion signal a resilient economy, which may reduce the immediate likelihood of Fed rate cuts, as these indicators support sustained economic momentum.
The slightly softer inflation reading on the GDP Price Index suggests inflation pressures are continuing to moderate, which could offer some flexibility to the Fed.
Overall, the Fed is likely to view this data mix as supportive of a cautious, data-dependent approach, possibly maintaining current rates in the short term without rushing to cut, but monitoring to ensure inflation stays on a downward path.
If the Fed prioritizes strong growth and a resilient labor market, rate hikes or holds are more likely than cuts. If inflation remains subdued, it could permit a gradual easing down the line but probably not immediately.
Let me know if you want a detailed outlook on market reactions to this release or the potential Fed communication following today’s data.
#GOLD

DXY: Bulls Are Winning! Long!
My dear friends,
Today we will analyse DXY together☺️
The in-trend continuation seems likely as the current long-term trend appears to be strong, and price is holding above a key level of 98.471 So a bullish continuation seems plausible, targeting the next high. We should enter on confirmation, and place a stop-loss beyond the recent swing level.
❤️Sending you lots of Love and Hugs❤️
Bearish reversal?The US Dollar Index (DXY) is rising towards the pivot and could reverse to the 1st support.
Pivot: 99.24
1st Support: 98.27
1st Resistance: 99.97
Risk Warning:
Trading Forex and CFDs carries a high level of risk to your capital and you should only trade with money you can afford to lose. Trading Forex and CFDs may not be suitable for all investors, so please ensure that you fully understand the risks involved and seek independent advice if necessary.
Disclaimer:
The above opinions given constitute general market commentary, and do not constitute the opinion or advice of IC Markets or any form of personal or investment advice.
Any opinions, news, research, analyses, prices, other information, or links to third-party sites contained on this website are provided on an "as-is" basis, are intended only to be informative, is not an advice nor a recommendation, nor research, or a record of our trading prices, or an offer of, or solicitation for a transaction in any financial instrument and thus should not be treated as such. The information provided does not involve any specific investment objectives, financial situation and needs of any specific person who may receive it. Please be aware, that past performance is not a reliable indicator of future performance and/or results. Past Performance or Forward-looking scenarios based upon the reasonable beliefs of the third-party provider are not a guarantee of future performance. Actual results may differ materially from those anticipated in forward-looking or past performance statements. IC Markets makes no representation or warranty and assumes no liability as to the accuracy or completeness of the information provided, nor any loss arising from any investment based on a recommendation, forecast or any information supplied by any third-party.

FX Matrix: Dollar Index, GBP/USD & EUR/USDDollar Index : 99.394, 100.425 - 100.690
Euro: 1.14855 - 1.14477
GBP: 1.31643 - 1.31453

DXYThe DXY, or US Dollar Index, measures the value of the US dollar against a basket of six major world currencies: the euro (EUR), Japanese yen (JPY), British pound (GBP), Canadian dollar (CAD), Swedish krona (SEK), and Swiss franc (CHF). It is a weighted index, with the euro having the largest share, making movements in EUR/USD especially influential on the index. The DXY was created in 1973 by the US Federal Reserve to provide a clear benchmark for the dollar’s international strength after the collapse of the Bretton Woods system.
Since its inception, the DXY has served as a vital gauge of the dollar’s performance in global trade and financial markets. Historically, it reached its all-time high near 164.72 in 1985, during a period of aggressive US interest rate hikes and a strong economic expansion. Conversely, it hit its all-time low around 70.70 in 2008, at the peak of the global financial crisis, when confidence in the US economy sharply declined.
The index typically rises when investors seek safety in the US dollar, especially during global risk-off events or when US interest rates are relatively high. It also tends to strengthen during periods of US economic growth, reduced liquidity, or tightening by the Federal Reserve. On the other hand, the DXY weakens when the Federal Reserve cuts rates, inflation rises, or investor sentiment shifts toward riskier assets and other global currencies.
In the years following the COVID-19 pandemic, the DXY saw sharp movements. It rallied strongly in 2022 as the Federal Reserve raised interest rates aggressively to combat inflation, reaching levels above 114. This was followed by a pullback as inflation cooled and expectations of rate cuts emerged in 2023 and 2024. As of August 2025, the DXY stands at approximately 93.4, reflecting a weaker dollar compared to its recent highs, influenced by a more dovish Federal Reserve, growing US debt concerns, and rising investor interest in alternative assets such as gold and other currencies.
The DXY remains a key tool for traders, economists, and policymakers to assess the dollar’s position in the global economy. Its movements affect everything from commodity prices and trade balances to emerging market capital flows and inflation pressures worldwide.

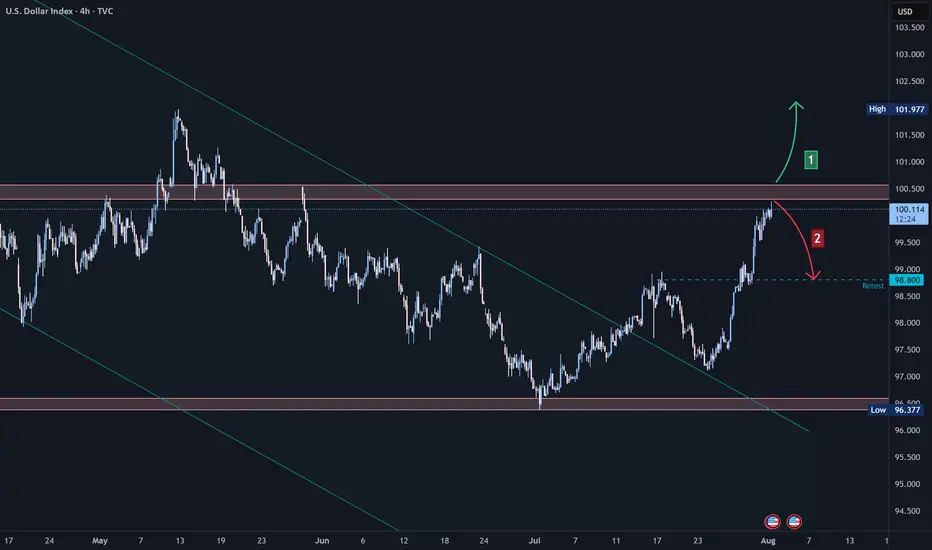
US Dollar Index (DXY) Technical Analysis:The DXY has recently exited a bearish wave, retested support levels, and began a recovery — currently trading near 100.09, a key resistance area.
🔹 If price breaks and holds above 100.09, the upward move may continue toward the 102.00 zone.
🔹 However, if the index rejects this level and reverses, a retest of 98.80 could follow.
⚠️ Disclaimer:
This analysis is for educational purposes only and does not constitute financial advice. Always perform your own analysis and monitor the markets before making any investment decisions.
DXY Outlook – From Bias to Execution Previous day closed bullish on DXY, leading me to look out for a bullish bias, On the 1H, I identified a familiar bullish pennant forming within the uptrend.

U.S. Dollar Index (DXY) – Pro Analysis | 1H Chart |1. Strong Bullish Momentum
DXY broke out sharply above the 99.41 resistance, showing clear strength from bulls with minimal pullbacks during the rally.
2. Short-Term Rejection at Supply
Price was rejected from the 99.978 zone — a key supply area. This indicates the presence of active sellers near the psychological 100 level.
3. Retesting Breakout Structure
Currently hovering just above 99.669, the DXY is retesting the previous breakout level. This could act as short-term support if bullish momentum resumes.
4. Next Key Zones
Resistance: 99.978 → 100.534
Support: 99.411 → 98.92
Break below 99.411 may invalidate the breakout.
5. Outlook
Bias remains bullish above 99.41. However, failure to reclaim 99.978 soon may signal temporary exhaustion or consolidation before next leg up.

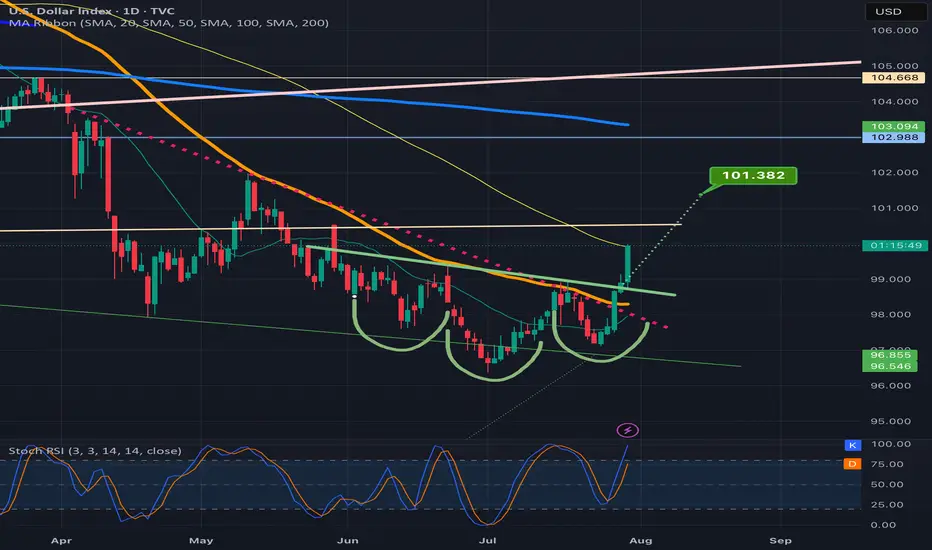
DXY attempting an inverse H&S breakoutSeeing a big green candle today on dxy after confirming the neckline of the inverse head and shoulders pattern as support on the previous daily candle.
DOLLAR INDEX U.S. Dollar Index (DXY) and US 10-Year Treasury Yield
Dollar Index (DXY) — will reclaim 103-102 level if it crosses 100 mark currently is at 98.34 and faces immediate supply roof ,a make or break situation awaits dollar buyers .
Over the past month, the Dollar Index has gained about 2%, although it is still down over 5% compared to a year ago. The recent uptick follows a period of volatility and selling, with investors recalibrating expectations after the resolution of trade risk premiums and recent U.S.–EU trade deals.
US 10-Year Treasury Yield keep rising after its drop from 4.193% in early july to 4.5% on 17th
Yield on the US 10-year Treasury note is currently about 4.42% , modestly higher than last week and unchanged from the previous session.
Current levels reflect ongoing uncertainty regarding future Federal Reserve policy moves, cautious optimism regarding U.S. economic strength, and some abatement of safe-haven flows after recent global trade developments.
Relationship & Market Synopsis
DXY and the 10-year yield typically have a positive correlation: When Treasury yields rise, the dollar often follows, as higher yields make dollar-denominated assets more attractive to global investors. Conversely, falling yields can weigh on the dollar. However, in 2025, there have been periods of divergence due to external shocks and policy uncertainty.
Current setup: Both DXY and the 10Y yield are rising modestly, signaling a shift to a more constructive tone for the U.S. dollar as risk sentiment stabilizes and investors scale back some safe-haven trades. Recent U.S. economic resilience and fading tariff fears have reduced the need for defensive flows, supporting both yields and the dollar.
Forward outlook: Market consensus expects limited further upside for Treasury yields unless there are strong surprises in U.S. data or Federal Reserve communication. The DXY is projected to stabilize near current levels or drift higher on persistent U.S. economic momentum.
Summary:
Both the Dollar Index and US 10-year Treasury yield are modestly higher as of July 29, 2025. Their positive price action reflects improving US growth prospects, reduced global risk premiums, and recalibrated market expectations on Fed policy. While their relationship is generally positive, periods of divergence have occurred in 2025 due to trade, policy, and economic shocks. Currently, both are showing moderate gains as investor sentiment stabilize

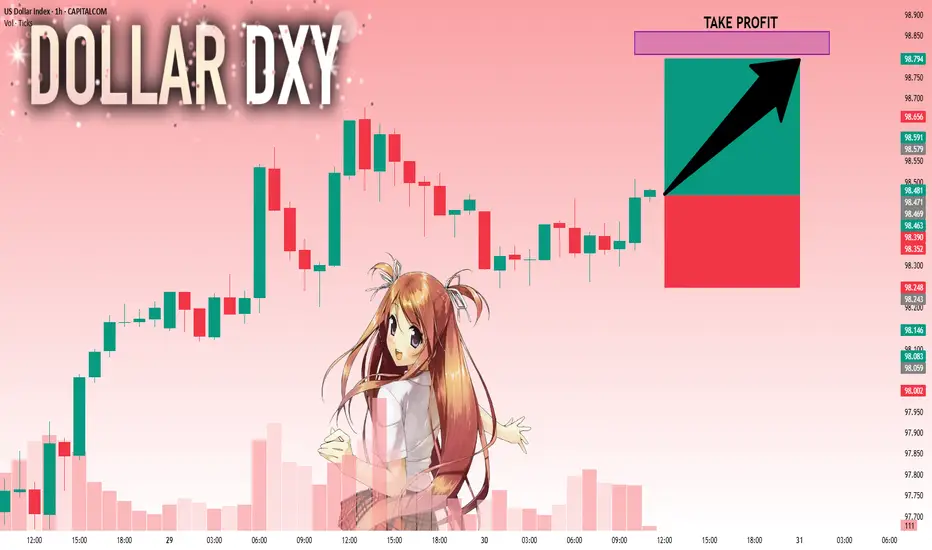
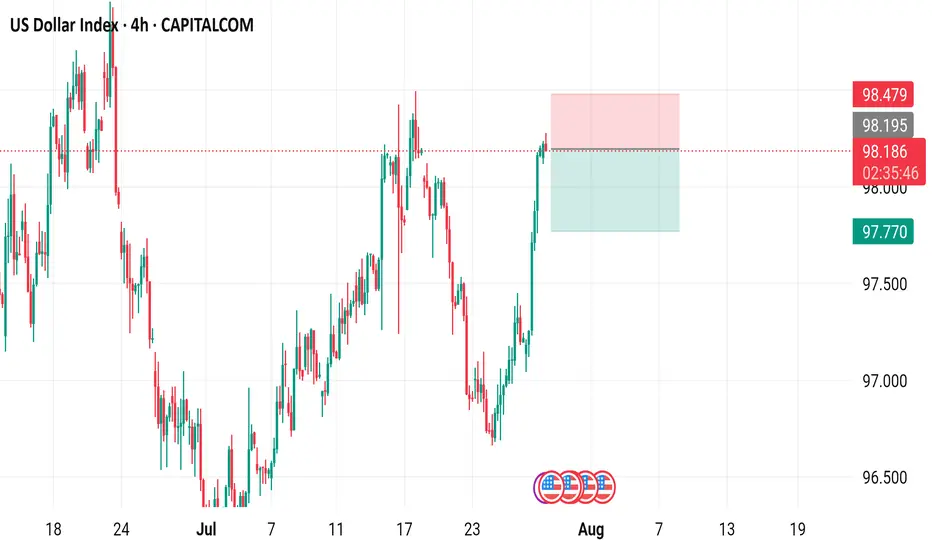
US Dollar Index (DXY) - 4 Hour Chart4-hour chart from CAPITALCOM displays the recent performance of the US Dollar Index (DXY), showing a current value of 98.190 with a slight decline of 0.009 (-0.01%). The chart highlights key price levels, including a recent sell signal at 98.189 and a buy signal at 98.243, with a resistance zone marked between 98.195 and 98.479. The index has experienced fluctuations, with notable drops and recoveries, and is currently trending near the 98.190 level as of July 29, 2025.

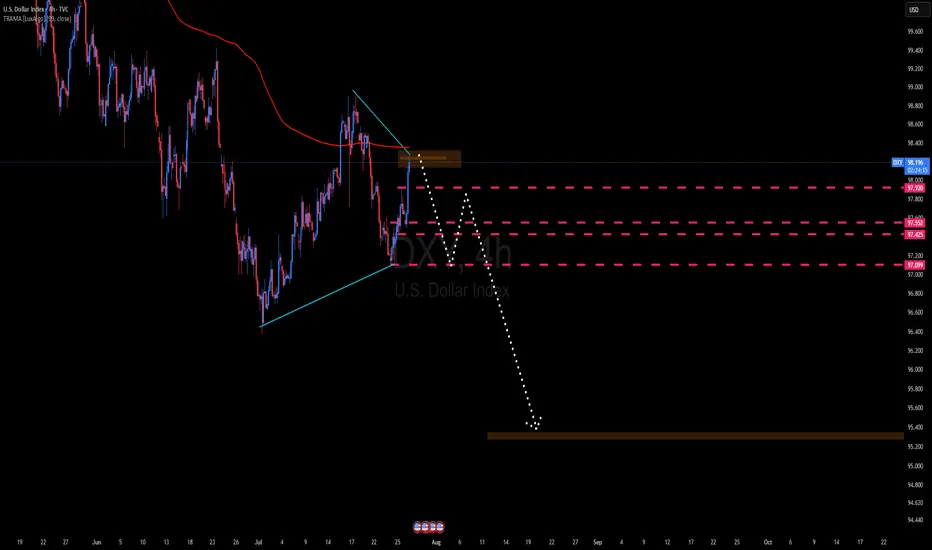
DXY Bearish Trend The DXY is expected to enter a bearish phase, with a potential decline starting from the 98.26–98.35 range, and possibly extending down to the 95.20–94.50 levels, which are anticipated to act as key support zones during the upcoming downtrend
DXY 4Hour TF - August 3rd,2025🟦 DXY 4H Analysis Neutral idea
📅 August 3, 2025
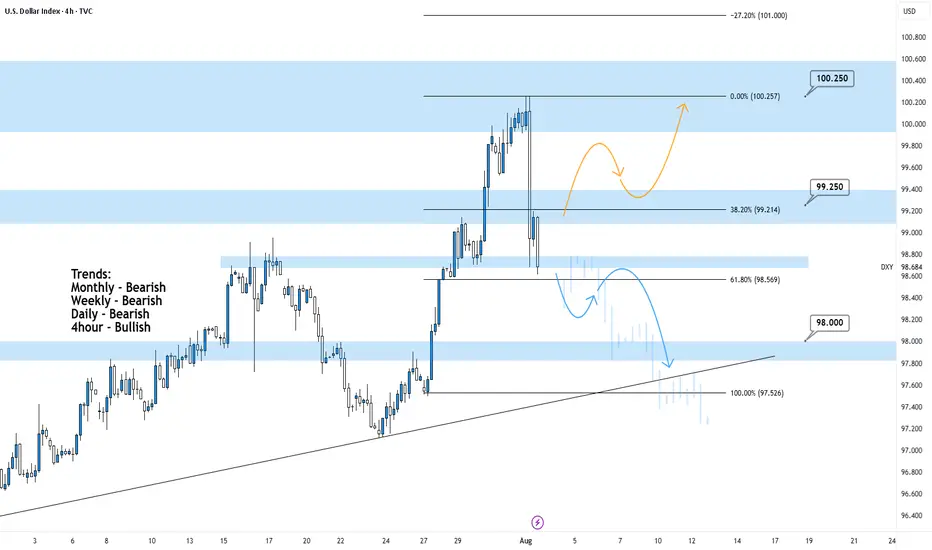
🔹 Top-Down Trend Bias:
• Monthly – Bearish
• Weekly – Bearish
• Daily – Bearish
• 4H – Bullish
The dollar index is in a larger bearish cycle but just bounced from near-term resistance around 100.250. While the 4H shows temporary strength, we’re trading into major resistance and we may see it short lived.
🔍 Key Levels to Watch
• Support: 98.00
• Resistance Zones: 99.25 and 100.25
• 61.8% Fib: 98.57
Price is currently testing structure after rejecting from the 100.25 resistance zone. This area remains a strong ceiling unless the higher timeframe structure shifts.
✅ Scenario A: Bearish Continuation (Blue Path)
1. Bearish Structure confirmation below the current zone
2.If bearish rejection confirms, expect price to continue toward 98.00, possibly 97.50
3.Clean confluence with the higher timeframe trend
⚠️ Scenario B: Bullish Extension (Orange Path)
1.If price breaks and holds above 99.25, we may see a continuation toward 100.25
2.Short-term bullish strength, but against HTF bias
3.Must treat as a counter-trend idea unless confirmed with HTF structure shift
🧠 Final Notes
• 98.50 is the key decision zone, watch reaction closely
• Trend remains bearish on all major timeframes
• Don’t force the long, lean bearish unless structure proves otherwise
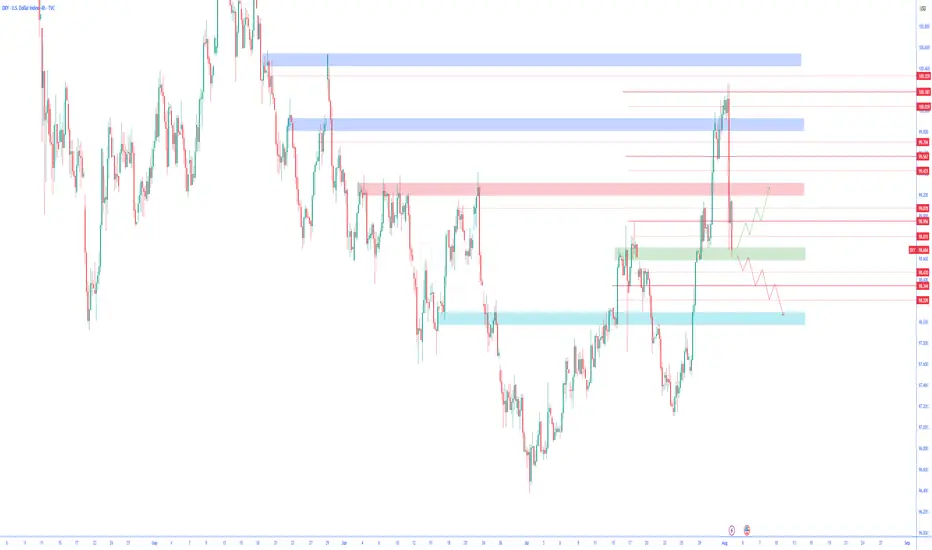
Technical Analysis | DXY | U.S. Dollar Index4-Hour Timeframe🔍 Technical Analysis | DXY | U.S. Dollar Index
4-Hour Timeframe
After hitting a strong supply zone marked in blue at the top of the chart, the price faced selling pressure and entered a bearish phase. Currently, the price is trading within a decision zone between buyers and sellers, where both bullish and bearish scenarios are possible.
🔼 Bullish Scenario:
If the price finds support at the mid-level support zone marked in green, and signs of a bullish reversal appear—such as proper candlestick formation or a renewed breakout of minor resistances (creating higher highs)—then the index is expected to move toward higher resistance levels.
🔽 Bearish Scenario:
Considering the market structure, if the mid-level support is lost and the price settles below this zone, the downtrend may accelerate. The dollar index could then move toward the lower support zone, marked in blue, which previously acted as a strong barrier and reversal area. This level may again serve as a key point to watch for market reactions.
✅ Conclusion
The U.S. Dollar Index is currently in a corrective phase, oscillating within a sensitive range. The price reaction to the current support zone will likely determine the next directional move. Therefore, it is recommended to wait for a confirmed breakout or bounce from this area before entering any trades.
104This channel is not providing individualized trading or investment advice, nor is it a banking service, brokerage service, trading service, investment service or money management service

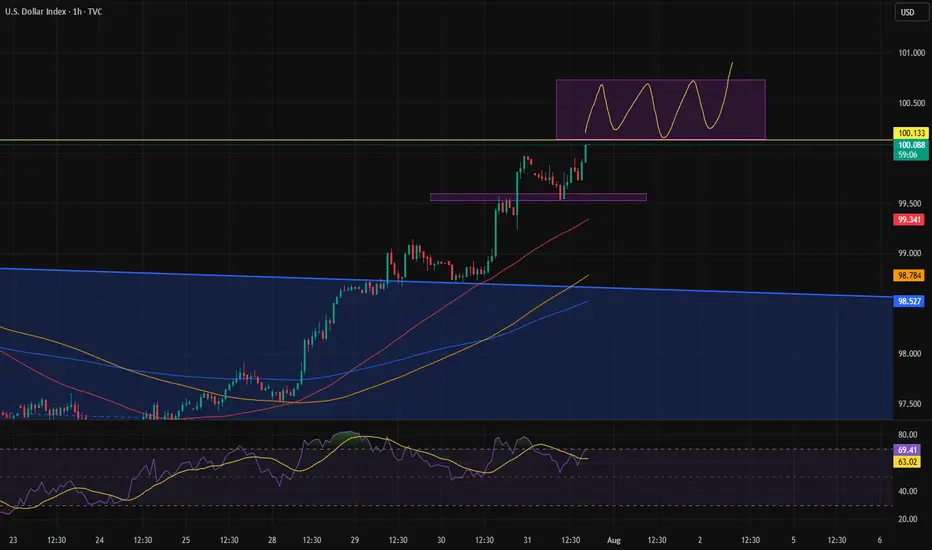
Range above 100.It seems like the dollar is trying to push back above the 100 level after a long time, and it's likely forming a range up there to establish stability in that zone.
DXY still in downward channel. Rejection here = BTC rally The DXY is still in a downward sloping channel and trying to break back above the previous 2-year cycle low, but I think will reject here and kick off the next leg of the BTC rally.
Ideally we get a big DXY drop and ultimately break below the 95% level and on down into 'Bitcoin Super Rally Zone'🚀

DXY (US Dollar Index)After breaking out of the downtrend and successfully testing the previous resistance level following the breakout from the Falling Wedge, the US Dollar Index looks poised for upward movement. This could temporarily slow down crypto due to dollar strength. 💵
July was nice, but August has historically been the worst month of the year — and we need to be prepared for that.

DXY Buyers Catching BidSee chart for analysis but even with price sitting inside levels of supply, we could easily see stronger Fundamentals coming out to drive this dollar back up into 100.5 areas of monthly supply. Short-term I remain bullish with long term views to the downside.

THE DOLLAR INDEX HAS FINALLY BROKEN THE DOWNWARD TRENDLINETVC:DXY (Dollar Index) has been in massive downward trend from the beginning of the year 2025 which was very bad for the Dollar. as from the previous weeks, we have been seeing the dollar index making some significant moves is very interesting as this will cause pairs like USDJPY to start pumping as well, because USDJPY is correlates positively with DXY why pairs like EURUSD,GBPUSD AND GOLD will be dropping. As a matter of fact let's see close the daily candle above the current.resistance level before anticipating for any massive move.
NOTE: THIS IS NOT A FINANCIAL ADVICE DO YOUR RESEARCH.
FOLLOW ME FOR MORE UPDATES.
