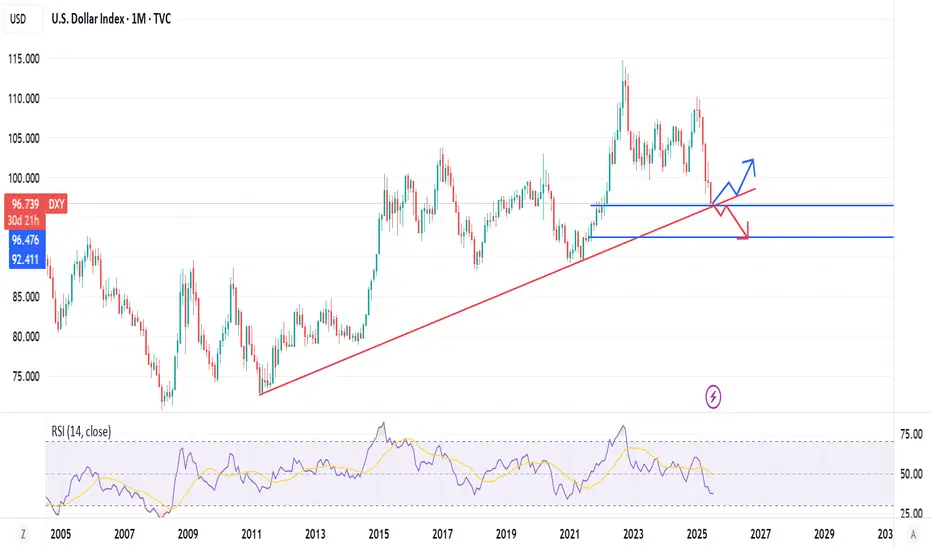
DXY LONG 03/07/2025Here we have the DXY hitting the resistance of a multi-year confirmed tunnel, while the down trend seems very strong, and can break trough some more to the downside, its a good spot to start picking up some UUP stocks, I belive price will eventually break and hit the 93 price mark, will make a double bottom and run back up inside the channel.
Good luck
USXUSD trade ideas

Dollar Index (DXY) Bearish Trend IntactThe Dollar Index (DXY) cycle, originating from its September 2022 peak, remains incomplete and exhibits a bearish outlook, signaling potential for further declines. The descent from the May 29, 2025 high is currently unfolding as a five-wave impulse pattern. From this high, wave ((i)) concluded at 98.35, followed by a corrective rally in wave ((ii)). The rally formed as an expanded flat, peaking at 99.43 as depicted on the one-hour chart below.
Subsequently, the Index extended lower, forming a nested structure. Within this decline from wave ((ii)), wave i bottomed at 97.7, with a corrective wave ii rally reaching 98.2. Wave iii then drove the Index lower to 97, followed by wave iv peaking at 97.49. The final leg, wave v, completed at 96.37, marking the end of wave (i). Currently, a corrective rally in wave (ii) is underway, aiming to retrace the decline from the June 23, 2025 peak. This rally appears to be unfolding as a zigzag pattern, with wave a concluding at 97.15 and wave b dipping to 96.69. Wave c is expected to target the 100%–161.8% Fibonacci extension of wave a, projecting a range of 97.45–97.9.
Should the Index reach this zone, it may encounter selling pressure, potentially leading to further downside or a three-wave pullback. As long as the pivot high at 99.4 remains intact, any rally is likely to falter in a 3, 7, or 11-swing structure, reinforcing the bearish bias for additional declines.

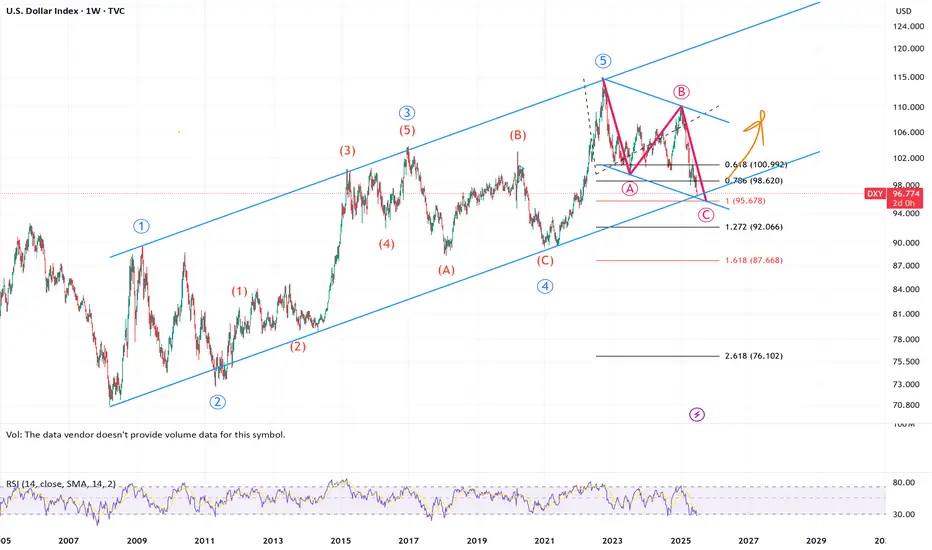
USD weaknening is coming to an end?DXY is soon reaching a 1:1 second leg down (measured at 95.678).
Similarly, EURUSD is reaching a 1:1 since the Sept 1 (2022) low (measured at 1.2046).
A Dollar in Freefall and a Bitcoin on the Brink
In the grand theater of global finance, narratives rarely align with perfect symmetry. The market is a complex ecosystem of competing forces, a cacophony of signals where long-term tectonic shifts can be momentarily drowned out by the piercing alarms of short-term volatility. Today, we stand at the precipice of one of the most profound and fascinating divergences in modern financial history, a story of two assets locked in an inverse dance, each telling a radically different tale about the immediate future.
On one side of this chasm stands the titan of the old world, the U.S. Dollar. The bedrock of global commerce, the world’s undisputed reserve currency for nearly a century, is in a state of unprecedented crisis. The U.S. Dollar Index (DXY), the globally recognized measure of the greenback’s strength against a basket of other major currencies, is in freefall. It is suffering its most catastrophic crash since 1991, and by some measures, is enduring its worst year since the historic turmoil of 1973. This is not a minor correction; it is a fundamental challenge to the dollar’s hegemony, a macro-level event driven by seismic shifts in U.S. economic policy, including aggressive trade tariffs and ballooning government deficits. For the world of alternative assets, a collapsing dollar is the loudest possible bullhorn, a clarion call to seek refuge in stores of value that lie beyond the reach of any single government.
On the other side of the chasm is the digital challenger, Bitcoin. Born from the ashes of the 2008 financial crisis as an answer to the very monetary debasement the dollar is now experiencing, Bitcoin should, by all fundamental logic, be soaring. The dollar’s demise is the very thesis upon which Bitcoin’s value proposition is built. And yet, while the long-term case has never looked stronger, the short-term picture is fraught with peril. A close reading of its technical chart reveals a market showing signs of exhaustion. A key momentum indicator, the stochastic oscillator, is flashing a stark warning, suggesting that the digital asset, far from rocketing to new highs, could be on the verge of a significant drop, a painful correction that could pull its price back below the psychological threshold of $100,000.
This is the great divergence. The macro-economic landscape is screaming for a flight to safety into hard assets like Bitcoin, while the micro-level technicals of Bitcoin itself are suggesting an imminent storm. It is a battle between the long-term fundamental signal and the short-term technical noise, a dilemma that forces every market participant to ask themselves a critical question: In a world where the old rules are breaking down, do you trust the map or the compass?
Chapter 1: The Fall of a Titan - Deconstructing the Dollar's Demise
To understand the magnitude of Bitcoin’s long-term promise, one must first dissect the anatomy of the dollar’s current collapse. The U.S. Dollar Index, or DXY, is not merely a measure of the dollar against a single currency; it is a weighted average of its value relative to a basket of six major world currencies: the Euro, the Japanese Yen, the British Pound, the Canadian Dollar, the Swedish Krona, and the Swiss Franc. Its movement is a reflection of global confidence in the U.S. economy and its stewardship. For this index to suffer its worst crash since 1991 is a historic event. To be on pace for its worst year since 1973 is a paradigm-shifting crisis.
The year 1973 is not a random benchmark. It was the year the Bretton Woods system, which had pegged global currencies to the U.S. dollar (which was in turn pegged to gold), officially died. Its collapse ushered in the modern era of free-floating fiat currencies. For the dollar’s current performance to be compared to that chaotic, system-altering period is to say that the very foundations of the post-1973 monetary order are being shaken.
The catalysts for this historic weakness are rooted in a dramatic shift in American economic policy, largely attributed to the actions of President Donald Trump’s administration. The two primary drivers are a protectionist trade policy and a fiscal policy of burgeoning deficits.
First, the tariffs. The implementation of broad tariffs on imported goods was intended to protect domestic industries and renegotiate trade relationships. However, such measures are a double-edged sword for a nation's currency. They create friction in the intricate web of global supply chains, increase costs for consumers and businesses, and often invite retaliatory tariffs from trading partners. This environment of trade conflict creates economic uncertainty, which can deter foreign investment. When international capital becomes wary of deploying in a country, demand for that country’s currency wanes, putting downward pressure on its value.
Second, and perhaps more fundamentally, are the rising deficits. The U.S. government has been running massive budget deficits, spending far more than it collects in revenue. This debt must be financed. When a country runs a large budget deficit alongside a large current account deficit (importing more than it exports), it becomes heavily reliant on foreign capital to purchase its government bonds. If the world’s appetite for that debt falters, or if the sheer volume of new debt issuance becomes too large to absorb, the nation’s central bank may be implicitly forced to monetize the debt—effectively printing new money to buy the bonds. This expansion of the money supply is the classic recipe for currency debasement.
The combination of trade protectionism and fiscal profligacy has created a perfect storm for the dollar. Global investors, looking at the rising deficits and the unpredictable trade environment, are beginning to question the long-term stability of the dollar as a store of value. This erosion of confidence is what is reflected in the DXY’s historic plunge. A weaker dollar makes U.S. exports cheaper and imports more expensive, but its most profound effect is on the global investment landscape. It forces a worldwide repricing of assets and sends a tidal wave of capital searching for alternatives that can preserve wealth in an era of fiat decay.
Chapter 2: The Digital Phoenix - Bitcoin's Long-Term Bull Case
In the world of finance, every action has an equal and opposite reaction. As the value of the world's primary reserve asset erodes, the value of its antithesis should, in theory, appreciate. Bitcoin is the dollar’s antithesis. Where the dollar’s supply is infinite and subject to the political whims of policymakers, Bitcoin’s supply is finite, transparent, and governed by immutable code. There will only ever be 21 million Bitcoin. This fundamental, mathematically enforced scarcity is the core of its value proposition.
The inverse correlation between the DXY and Bitcoin is one of the most powerful and intuitive relationships in the digital asset space. When the DXY falls, it signifies that the dollar is losing purchasing power relative to other major currencies. For investors around the globe, this means that holding dollars is a losing proposition. They begin to seek out assets that are not denominated in dollars and cannot be debased by the U.S. Federal Reserve. Bitcoin stands as the prime candidate for this capital flight. It is a non-sovereign, globally accessible, digital store of value that operates outside the traditional financial system. A falling dollar is therefore the strongest possible tailwind for Bitcoin, validating its very reason for existence.
This relationship transcends simple price mechanics; it is a philosophical and macroeconomic hedge. Owning Bitcoin is a bet against the long-term viability of the current debt-based fiat monetary system. The dollar’s crash, driven by deficits and monetary expansion, is not a flaw in the system; it is a feature of it. Bitcoin offers an escape hatch. It is a lifeboat for investors who see the iceberg of sovereign debt on the horizon.
This narrative is what has fueled the wave of institutional adoption that has defined the current market cycle. Sophisticated investors and corporations are not allocating to Bitcoin because they are speculating on short-term price movements. They are buying it as a long-term strategic reserve asset, a hedge against the very macroeconomic turmoil that the dollar’s crash represents. They see a world drowning in debt and a global reserve currency being actively devalued, and they are making a calculated, multi-generational bet on a system of verifiable digital scarcity. From this perspective, the long-term bull case for Bitcoin has never been clearer or more compelling. The dollar’s historic weakness is the ultimate validation of the Bitcoin thesis.
Chapter 3: The Ghost in the Machine - Bitcoin's Short-Term Technical Warning
If the story ended with the macro-economic picture, the path forward would be simple. But markets are not simple. They are a reflection of human psychology, a tapestry of fear and greed woven in real-time. While the fundamental, long-term story points resolutely upward, the short-term evidence, as read through the language of technical analysis, is painting a much darker picture.
Technical analysis operates on the principle that all known information, including the bullish macro fundamentals, is already reflected in an asset's price. It seeks to identify patterns and gauge market momentum to predict future movements. One of the most trusted tools for measuring momentum is the stochastic oscillator. It does not measure price or volume itself, but rather the speed and momentum of price changes. Think of it like a car's tachometer: it tells you not how fast you are going, but how hard the engine is working to maintain that speed.
The stochastic oscillator operates on a scale of 0 to 100. A reading above 80 is considered "overbought," suggesting the asset has moved up too quickly and the rally may be running out of steam. A reading below 20 is considered "oversold," suggesting a decline may be exhausted. The current technical analysis of Bitcoin’s chart reveals a deeply concerning signal from this indicator.
Despite the overwhelmingly bullish news of the dollar’s collapse, Bitcoin’s price momentum is reportedly waning. The stochastic oscillator is likely showing what is known as a "bearish divergence." This occurs when the price of an asset pushes to a new high, but the oscillator fails to do so, creating a lower high. This is a classic warning sign. It’s the market’s equivalent of a car’s engine sputtering and revving less intensely even as the driver pushes the accelerator to the floor. It suggests that the underlying buying pressure is weakening, that the rally is becoming exhausted, and that a reversal or significant correction may be imminent.
The technical forecast of a potential drop below the $100,000 level stems directly from this type of signal. It implies that the recent price strength is not supported by genuine momentum and that the market is vulnerable. Why would this happen when the fundamental news is so positive? There are several possibilities. Short-term traders who bought at lower prices may be taking profits. The market may be flushing out over-leveraged long positions, triggering a cascade of liquidations. Or, it could simply be the natural rhythm of a market. No asset moves up in a straight line. Even the most powerful bull trends require periods of consolidation and correction to shake out weak hands, build a stronger base of support, and gather energy for the next major advance. A pullback to below $100,000, while painful for those who bought at the top, could be a perfectly healthy and necessary event in the context of a much larger, multi-year bull market.
Chapter 4: Reconciling the Irreconcilable - The Investor's Dilemma
This great divergence presents every market participant with a profound dilemma, forcing a clear-eyed assessment of their own investment philosophy and time horizon. The market is speaking in two different languages simultaneously, and the message you hear depends on the language you choose to listen to.
For the long-term investor, the individual or institution with a five, ten, or twenty-year outlook, the story is clear. The historic crash of the U.S. dollar is the signal. It is the fundamental, world-altering event that confirms their thesis. The debasement of the world’s reserve currency is a generational opportunity to allocate capital to a superior, non-sovereign store of value. From this vantage point, the bearish reading on a short-term stochastic oscillator is, at best, irrelevant noise. It is the momentary turbulence felt on a flight destined for a much higher altitude. The strategy for this investor is one of conviction. They may choose to ignore the short-term dip entirely, or more likely, view it as a gift—a final opportunity to accumulate more of a scarce asset at a discount before the full force of the dollar’s crisis is felt in the market. Their actions are guided by the macro map, not the short-term compass.
For the short-term trader, the world looks entirely different. Their time horizon is measured in days, weeks, or months, not years. For them, the bearish divergence on the stochastic oscillator is the signal. The macro story of the dollar’s decline is merely the background context. Their primary concern is managing risk and capitalizing on immediate price swings. A warning of a potential drop below $100,000 is an actionable piece of intelligence. It might prompt them to take profits on existing long positions, hedge their portfolio with derivatives, or even initiate a short position to profit from the anticipated decline. Their survival depends on their ability to react to the compass of market momentum, regardless of the map’s ultimate destination.
The most sophisticated market participants, however, attempt to synthesize these two perspectives. They recognize that the long-term macro trend provides the overarching directional bias, while the short-term technicals provide the tactical roadmap for navigating that trend. Such an investor would maintain a core long position in Bitcoin, acknowledging the powerful tailwind of the dollar’s collapse. However, they would use the technical signals to actively manage their position and optimize their entries and exits. They might trim their position when the stochastic indicator signals overbought conditions, taking some profit off the table to reduce risk. They would then stand ready to redeploy that capital and add to their core holding when the technicals signal oversold conditions after the very correction they anticipated. This approach allows them to maintain their long-term conviction while respecting the short-term risks, blending the art of the trader with the discipline of the investor.
Conclusion: The Signal and the Noise
The financial markets are standing at a historic crossroads. The U.S. dollar, the sun around which the global monetary system has orbited for generations, is dimming. Its historic crash is a signal of the highest order, a fundamental warning that the era of unchallenged fiat dominance is facing its most serious test. This decay is creating a powerful gravitational pull toward assets defined by scarcity and sovereignty, with Bitcoin as the undisputed digital leader. This is the signal.
Simultaneously, the internal mechanics of the Bitcoin market are showing signs of short-term fatigue. The warnings from technical indicators like the stochastic oscillator are a reminder that no market is immune to the laws of gravity, that periods of profit-taking and consolidation are a natural and healthy part of any long-term advance. This is the noise.
The great challenge, and the great opportunity, for every investor today is to learn to distinguish between the two. The collapse of the dollar is a paradigm shift, while the potential drop in Bitcoin’s price is a cyclical correction. The former defines the destination; the latter describes the terrain along the way. The current divergence is a test of thesis, of timeframe, and of temperament. Those who are shaken out by the short-term noise will likely miss the long-term signal. But those who understand that the dollar’s fall is the very reason for Bitcoin’s rise, and who have the conviction to see the short-term turbulence for what it is, will be best positioned to navigate this great divergence and witness the dawn of a new financial landscape.

Possibility of correction Given the behavior of the indicator within the current resistance range, possible scenarios have been identified. If the resistance range is broken, an upward and fluctuating trend to the red resistance range is likely.


USD Tries to Break the Tide at NFPIt's been a painful week and a half for the USD.
Around the June FOMC meeting a hopeful bounce had built as the Fed sounded a bit less-dovish. While inflation remains below their expectations the labor market had held up relatively well, and with the threat of possible inflation from tariffs they didn't seem to be in any hurry to cut rates.
But then last week opened with Michelle Bowman saying she supported a rate cut as early as July, and DXY put in a bearish engulfing pattern. And then into the end of Q2 it was constant bleeding as the currency continued to trip down to fresh three-year lows.
Interestingly, the shocking miss on ADP data this morning illustrates weakness in the labor market, yet the USD is currently showing its first green day since last week's open.
This is likely more due to just how oversold the currency has become but it sets the stage for NFP tomorrow. While that data point is a major driver, it's supply and demand, which is denominated by positioning, that pushes prices. For tomorrow the interest is in a better-than-expected NFP print bringing a short-term squeeze in the USD, after which markets will get a look to see just how aggressive bears remain to be. The big area of interest for this is the prior swing low, at the 97.91 level, which set support in April and then held the lows in June, until the late-month breakdown move.
To date that spot still hasn't been tested for resistance and if sellers do get a chance to offer at that level, we get to see how aggressive they remain to be. - js

dollar elliott wave countingdxy is falling since it peaked in Q4 2022
since their last 75bps hike dollar is constantly falling and stocks, gold, bitcoin constantly rising and making new all time high
wave W = wave Y
(equal in length, 100% projection for wave Y)
since starting of the year due to trump tariff dollar is falling
this is year in first half dollar saw biggest collapse since end of gold standard
now 100% projection target for wave Y at 95 area is big static support level
if dxy recover back to 100 area then this will be first sign of reversal

The end of the downward trend for the dollar index on the stockAccording to market structure, a new bullish trend is approaching. The stock market clearly reflects the overvaluation of its main exchanges. Everything seems to indicate that there will be news about the Fed's strengthening of interest rates. Something will happen. Long-term entries for USDXYZ assets, and short XYZUSD. MY POINT OF VIEW ON THE STOCK MARKET.

just slightly kidding, yes or no DXY MONTHLYjust slightly kidding, yes or no DXY MONTHLY\
bullish. so very bullish
let us know!
free transparent no edit no delete
🐉We value full transparency. All wins and fails fully publicized, zero edit, zero delete, zero fakes.🐉
🐉Check out our socials for some nice insights.🐉
information created and published doesn't constitute investment advice!
NOT financial advice

DXYDXY price has come down to test the important support zone 96-95. If the price cannot break through the 95 level, it is expected that the price will rebound. Consider buying the red zone.
🔥Trading futures, forex, CFDs and stocks carries a risk of loss.
Please consider carefully whether such trading is suitable for you.
>>GooD Luck 😊
❤️ Like and subscribe to never miss a new idea!

DXY UpdateAs expected the dollar has decreased in value over the past couple weeks as seen with my earlier post
We have come to a key level here for the dollar. FX tends to move in prolonged waves of price increases and decreases so this could potentially be the be the start of a prolonged decline

DXY Long-Term Technical Outlook: Channel Structure, Pullbacks & ## **DXY (Dollar Index) Technical Analysis – 2W Chart**
### **1. Uptrend Since 2008**
The Dollar Index (DXY) has been in a **long-term uptrend** since the 2008 bottom (around 70.70). The chart shows a clear pattern of **higher highs and higher lows**, establishing a bullish market structure over the past 15+ years.
---
### **2. Ascending Channel**
The price has been moving consistently within a well-defined **ascending channel**. Several reactions from the channel boundaries are visible:
- **Support (lower trendline):** 2008, 2011, 2018, 2021, 2024
- **Resistance (upper trendline):** 2009, 2017, 2022
This suggests that the market is respecting the technical boundaries of the channel remarkably well.
---
### **3. Historical Pullbacks Within the Channel (13.5% – 15%)**
The chart highlights major **pullbacks** from local tops, all falling within the **-12.6% to -16.9%** range, showing high consistency:
| Year | Drop | % Decline |
|-------------|----------|----------------|
| 2009 | -14.76 | -16.47% |
| 2010 | -14.97 | -16.90% |
| 2017 | -15.17 | -14.61% |
| 2020 | -13.65 | -13.25% |
| 2022 | -14.90 | -12.98% |
| 2024/2025 | -13.90 | -12.61% |
This implies that **a retracement of 13–15%** from a local high is a historically "normal" correction within the ongoing uptrend.
---
### **4. EMA Analysis – 24, 120, 240** (2Y,5Y,10Y)
The chart includes three Exponential Moving Averages (EMAs), reflecting short-, medium-, and long-term trends:
- **EMA 24 (white line):** Reacts to short-term price action. Price is currently breaking below it, suggesting weakness in short-term momentum.
- **EMA 120 (red line):** Reflects the mid-term trend. Price is **right at the edge**, often acting as a **support level** in bullish markets.
- **EMA 240 (blue line):** Represents the long-term outlook. **Price has never stayed below this level for long** over the past 15 years, making this EMA a **critical support** for the long-term trend.
---
### **Conclusion & Potential Scenarios**
📉 **Bearish Scenario:**
If DXY breaks below the **EMA 240** and the **lower channel boundary**, it could indicate a **reversal of the long-term uptrend**, which hasn’t happened since 2008.
📈 **Bullish Scenario:**
If DXY holds above the **EMA 120** or bounces from the **EMA 240** and the **channel support**, we could expect a rally toward the **Fibonacci levels** (0.5 at 102.04 or 0.382 at 105.04), or even a retest of the highs around **114.78**.

U.S. dollar index DXY analysis- daily time frame ✅ U.S. Dollar Index (DXY) Analysis — Daily Timeframe
👤 A TVC:DXY trader’s perspective:
When I look at this chart, several key points immediately stand out:
1️⃣ Long-Term Trend
On the weekly and daily timeframe, the major trend has turned bearish after peaking around 114. We see a clear series of lower highs and lower lows confirming the downtrend.
The sharp rally from 89 to 114 in the past was a strong impulsive move, which is now undergoing a deep correction. Currently, price is hovering around a major historical support near 96.
2️⃣ Key Support Zone
The current price near 96.7 is sitting right at a significant support area that has triggered considerable buying interest in the past.
If this support decisively breaks, the green zone marked as DD (around 93–95) represents a strong long-term demand zone and will likely be the next liquidity target for buyers.
3️⃣ Resistance (Supply Zones)
The four red-marked 4HR zones between 97 and 101.9 clearly show significant supply zones where sellers have stepped in on lower timeframes.
Should the price attempt a bounce from current levels, these resistance areas may act as a strong barrier to further upside.
4️⃣ Price Structure and Liquidity
Looking more closely, the market seems to be moving from a consolidation phase toward lower support liquidity. That means there is a high probability of a liquidity grab toward the 93–95 area before a potential fresh bullish leg.
At higher levels, unless the price can break and hold above 98 and then 100, we cannot confirm a trend reversal.
🔹 Summary
✅ Overall downtrend remains dominant
✅ 96–97 is a critical support zone
✅ A break below this support targets 93–95
✅ Trend reversal only possible with a confirmed break and hold above 98, and then 100–101
✅ The 4HR resistance zones (97–101) are strong hurdles for any bullish retracement
✅ As long as price remains below 98, any rally is likely just a corrective move
⚠️ Disclaimer: This analysis is for educational and informational purposes only and does not constitute financial advice or a recommendation to buy or sell. All trading decisions are solely your own responsibility.

USD Roadmap: Bullish Recovery or Structural Breakdown?TVC:DXY CAPITALCOM:DXY
🟢 Scenario A – Bullish Rebound (Red Arrow Up):
Price bounces from the lower channel and breaks toward:
107.348, 110.176, or even 111.901 resistance area.
If the dollar is supported by China buying USD, hawkish Fed, or geopolitical tensions, this scenario gains weight.
🔸 Resistance: Blue downward-sloping line (possible trendline resistance or lower high area)
🔸 Risk: Price could form a lower high and then reverse.
🔴 Scenario B – Bearish Breakdown (Red Arrow Down):
If the USD fails to break above resistance (around 107–112) and gets rejected…
Then we see a move back down, possibly breaking the long-term channel, aiming for the lower diagonal support zone or even sub-92.
🔸 This would signal a major shift in USD strength, possibly driven by:
Fed rate cuts
Global de-dollarization
China not supporting USD
Stronger EUR or CNY

DXY at the Crossroads: How the 108–110 could reshape the market
Key Highlights
The U.S. Dollar Index TVC:DXY is currently near an important resistance level of 108–110.
A potential reversal of the dollar at this level could lead to further growth in stock markets and strengthen cryptocurrencies, while a break above 110+ would continue to put pressure on risk assets.
If CAPITALCOM:DXY surpasses 110 and holds above it, there is a possibility of reaching as high as the 120 mark. A rejection from the 108–110 zone would indicate a downward trend developing, possibly pushing the index toward the 98 area or lower.
Future outcomes will depend on Federal Reserve monetary policy, global demand for the dollar and other safe-haven assets, as well as overall economic stability.
What about crypto?
There are serious risks for CRYPTOCAP:TOTAL2 CRYPTOCAP:TOTAL3 & CRYPTOCAP:OTHERS
A long-term perspective on ICEUS:DXY suggests that “alt seasons” tend to occur during periods of dollar weakness. Currently, the 108–110 zone and the MA50-W are pivotal. A potential DXY reversal here may act as a catalyst for another major altcoin rally in the coming months, while continued dollar strength could postpone any such “alt season.”
Shaka

Dollar Index Bearish to $96The DXY has been in a downtrend for a while & that bearish pressure is not over yet. I expect more bearish downside towards the $96 zone, before we can re-analyse the market for any signs of bullish takeover.
⭕️Major Wave 3 Impulse Move Complete.
⭕️Major Wave 4 Corrective Move Complete.
⭕️Minor 4 Waves of Major Wave 5 Complete, With Minor Wave 5 Yet Pending.

USXUSD LOTWUSXUSD LOTW Potentially In.
H1 BOS confirms this for me. Targeting H4 Internal Liquidity & Daily FVG.
Let's see.

I would be looking for reversal patterns on the ES and the Russe7 1 25 I made a few mistakes naming some of the markets but if you can deal with that then I explain what my concerns are regarding some of the patterns. most of the trades that I posted as trading opportunities have moved higher and did not require large stops. I spent time on a certain pattern that I don't really talk about but it influenced my Trading and gives me caution not to stay in a market to Long.... and I tried to use the the gold and the silver because I really am tied into those markets and I'm concerned about a pattern on the gold that is actually giving a signal to be long but I'm still concerned about it and I tried to articulate that in the video.... it's about the concept of what that pattern represents to me..... and incorrect or the market trades differently it's not a big deal..... the irony in the video is that I tried to show that pattern thinking that I was in a certain Market and I had the wrong Market..... the only thing I would say is there's a certain pattern and they think Gold's a very good example and will give me a chance to talk about it in a couple of days and I want to see if it actually can make a new high which I am concerned about because I want that new high to sell some of my goal but I want a good price and it's a large amount.... and I'm not doing this to be egotistical or trying to prove a point.... I'm willing to show something that's actually going on and I'm willing to talk about it. a number of people are entering in my trades which is perfectly fine and they try to make statements in my videos that require that you go back and reevaluate those videos to see what happened and that's the best way to learn. I stopped looking at other people's charting mostly because I'm happy with what I do but also when people chart something and project a Target but never do anything else to help you determine if that projection was correct that's not of any value. if you can find somebody who finds an entry and tells you what it is or that it's about to happen and that person does a video on it which he cannot change so that even though you don't see the actual trade the market trades in the direction and has reversals that are outlined before they happen that's the best way to trade it completes the cycle of trading.... and the beautiful thing is if you post it you can't erase it.... that's how you can learn effectively if you go back and create the patterns that were shown to you previously.

DXY : Lets wait and seeThe chart above explains.
Price is in a hurry. Looks like time is limited. I think the snap-back would be a quick one.
Looking good judging the 10Y and 30Y movement now
Good luck @ 94.65


Tariffs your time is up!
Tariff pauses are ending on July 9th. Even if expected deals aren't reach, it's expect that we won't pause again. Expecting the dollar to regain strength into this date.

dxy looks on critical juncture dxy looks on critical juncture consolidation near 95 can lead to higher side but if it do not happen than lowerside can be the target