$CNIRYY -China's Inflation Data (June/2025)ECONOMICS:CNIRYY
June/2025
source: National Bureau of Statistics of China
- China’s consumer prices rose by 0.1% yoy in June 2025,
reversing a 0.1% drop in the previous three months and surpassing market forecasts of a flat reading.
It marked the first annual increase in consumer inflation since January, driven by e-commerce shopping events, increased subsidies for consumer goods from Beijing, and easing trade risks with the U.S.
Core inflation, which excludes volatile food and fuel prices, rose 0.7% yoy, marking the highest reading in 14 months and following a 0.6% gain in May.
On a monthly basis, the CPI fell 0.1%, after May's 0.2% drop, pointing to the fourth monthly decline this year.
CNIRYY trade ideas
$CNIRYY -China CPI (May/2025)ECONOMICS:CNIRYY
May/2025
source: National Bureau of Statistics of China
- China's consumer prices dropped by 0.1% yoy in May 2025, matching the declines seen in the previous two months and slightly outperforming expectations of a 0.2% decrease.
This was the fourth straight month of consumer deflation, highlighting challenges from ongoing trade risks with the US, sluggish domestic demand, and concerns over job stability. Non-food prices were flat for the second month in a row, as increases in housing (0.1% vs 0.1% in April), clothing (1.5% vs. 1.3%), healthcare (0.3% vs 0.2%), and education (0.9% vs 0.7%) were offset by a sharper drop in transport (-4.3% vs -3.9%).
On the food side, prices fell at a steeper rate (-0.4% vs -0.2%), down for the fourth month.
Core inflation, which excludes volatile food and fuel prices, rose 0.6%, marking the highest reading since January and following a 0.5% gain in the prior two months.
On a monthly basis, the CPI declined by 0.2% in May, reversing a 0.1% gain in April and indicating the third monthly drop so far this year.

$CNIRYY -China's CPI (March/2025)ECONOMICS:CNIRYY
March/2025
source: National Bureau of Statistics of China
- China's consumer prices fell by 0.1% year-on-year in March 2025, missing market expectations of a 0.1% increase and marking the second consecutive month of drop, as the ongoing trade dispute with the U.S. threatens to exert further downward pressure on prices.
Still, the latest drop was significantly milder than February’s 0.7% fall, supported by a smaller decline in food prices as pork prices accelerated and fresh fruit costs rebounded.
Meanwhile, non-food prices rose by 0.2%, reversing a slight dip of 0.1% in February, driven by increases in housing (0.1% vs 0.1%), healthcare (0.1% vs 0.2%), and education (0.8% vs -0.5%), despite a continued decline in transport costs (-2.6% vs -2.5%).
Core inflation, which excludes volatile food and fuel prices, rose 0.5% in March, rebounding from a 0.1% decrease in February. On a monthly basis, the CPI declined by 0.4%, a steeper fall than a 0.2% drop in February, marking the second straight month of contraction.

$CNIRYY - China's CPI DefelationaryECONOMICS:CNIRYY -0.7%
(February/2025)
source: National Bureau of Statistics of China
- China's consumer prices dropped by 0.7% yoy in February 2025, surpassing market estimates of a 0.5% decline and reversing a 0.5% rise in the prior month.
This was the first consumer deflation since January 2024, amid fading seasonal demand following the Spring Festival in late January.
Food prices fell the most in 13 months (-3.3% vs 0.4% in January), dragged by a steep decrease in cost of fresh vegetables (-12.6% vs 2.4%) and a sharp slowdown in pork prices (4.1% vs 13.8%).
Meanwhile, non-food prices edged lower (-0.1% vs 0.5%), as increases in housing (0.1% vs 0.1%) and healthcare (0.2% vs 0.7%) were offset by declines in education (-0.5% vs 1.7%) and transport (-2.5% vs -0.6%).
Core inflation, excluding volatile food and fuel prices, fell 0.1% in February, in contrast to a 0.6% rise in January.
Monthly, the CPI fell 0.2%, shifting from January's 11-month top of a 0.7% rise and marking the first drop since last November.
This fall was also steeper than consensus of a 0.1% decrease.

$CNIRYY -China Inflation Rate Hits 5-Month PeakECONOMICS:CNIRYY 0.5%
(January/2025)
source: National Bureau of Statistics of China
- China’s annual inflation rate surged to 0.5% in January 2025 from 0.1% in the prior month, above consensus of 0.4%.
This was the highest figure since August 2024, driven by seasonal effects from the Lunar New Year.
Meantime, producer prices fell by 2.3% yoy, keeping the same pace as in December while declining for the 28th month.

$CNIRYY -China's CPI (November/2024)ECONOMICS:CNIRYY
November/2024
source: National Bureau of Statistics of China
- China’s annual inflation rate unexpectedly eased to 0.2% in November 2024 from 0.3% in the previous month, falling short of market forecasts of 0.5% and marking the lowest figure since June.
This slowdown highlighted mounting deflation risks in the country despite recent stimulus measures from Beijing and the central bank's supportive monetary policy stance.
Food prices rose the least in four months (1.0% vs 2.9% in October), driven by softer increases in both fresh vegetables and pork. Meantime, non-food prices remained unchanged (vs -0.3% in October), with further rises in the cost of healthcare (1.1% vs. 1.1%) and education (1.0% vs 0.8%) and more declines in prices of transport (-3.6% vs -4.8%) and housing (-0.1% vs -0.1%). Core consumer prices, excluding food and energy, rose 0.3% yoy, the most in 3 months, after a 0.2% gain in October. Monthly, the CPI fell 0.6%, surpassing October's 0.3% fall and the estimated 0.4% drop while pointing to the sharpest decrease since March.

$CNIRYY -China's CPI (September/2024)ECONOMICS:CNIRYY
Inflation Data (September/2024)
source: National Bureau of Statistics of China
-China’s annual inflation rate stood at 0.4% in September 2024,
below market forecasts and August’s figure of 0.6%.
This was the 8th month of consumer inflation but was the lowest print since June,
highlighting the need for more policy support from Beijing to address growing deflation risks.
Non-food prices declined by 0.2%, following a 0.2% rise in August as the cost of transport shrank further (-4.1% vs -2.7%) due to lower crude oil prices.
Also, housing prices edged down (-0.1% vs flat reading) amid government efforts to further regulate the property market. Meanwhile, cost slowed for health (1.2% vs 1.3%) and education (0.6% vs 1.3%).
On the food side, prices rose for the second month, with the rate of increase the fastest in 20 months (3.3% vs 2.8%).
Core consumer prices, excluding food and energy costs, increased 0.1% yoy, the smallest rise since February 2021, after a 0.3% gain in August. Monthly, the CPI was unchanged, compared with consensus and August’s print of a 0.4% rise.

$CNIRYY (August/2024)- China's annual inflation rate edged up to 0.6% in August 2024 from 0.5% in July,
falling short of market forecasts of 0.7%.
Still, it was the highest print since February,
marking the 7th straight month of consumer inflation amid supply issues due to flaming heat and pouring rains.
Food prices rose for the first time since June 2023, with their rate of increase the fastest in 19 months (2.8% vs flat reading in July) as fresh vegetables rebounded sharply.
Meanwhile, non-food prices increased 0.2% yoy, much slower than the prior 0.7%, on softer rises in cost of clothing (1.4% vs 1.5%), housing (flat reading vs 0.1%), health (1.3% vs 1.4%), and education (1.3% vs 1.7%).
At the same time, transport costs fell at a steeper rate (-2.7% vs -0.6%), with lower oil prices offsetting higher cost of utilities.
Core consumer prices, deducting food and energy costs, increased 0.3% yoy, the least since March 2021.
Monthly, the CPI rose 0.4%, the second month of gain but lower than consensus of 0.5%.
source: National Bureau of Statistics of China

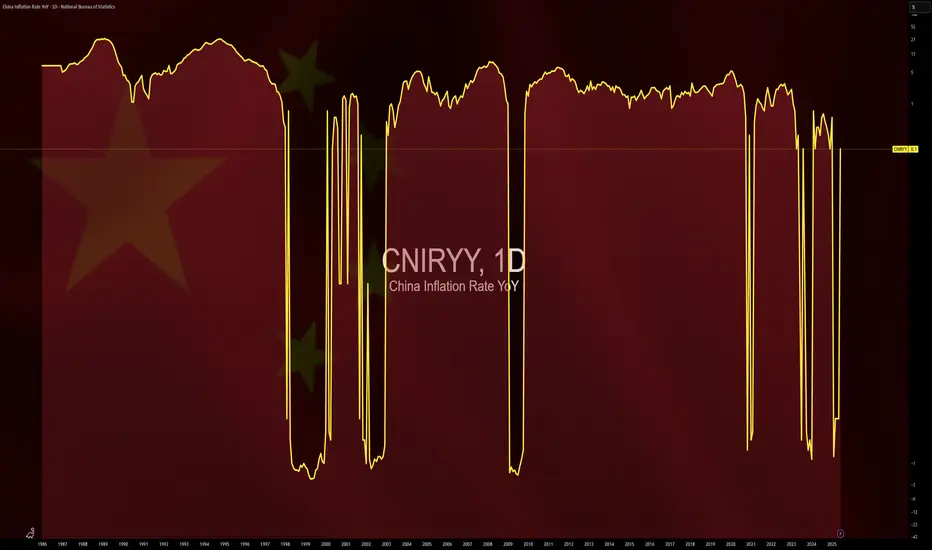
MACRO MONDAY 7 - CHINA DEFLATIONMacro Monday (7) - Advance Release
China Inflation Rate – $CNIRRY
China entered into deflationary territory in July 2023 and this is being shared by many with an extremely negative outlook for markets. I believe this chart outlines a very different perspective that leans more neutral than cautionary whilst also providing a more usable framework in the event of a recession scenario playing out.
🔴The last 3 global recessions commenced during China's peak inflationary periods, not during deflationary periods. This is the first clear indication from the chart (red circles).
🔵The last 3 periods of deflation in China signaled the forming of a market bottom in 2000 (over 14 months), thee market bottom in 2008 and resulted in positive S&P500 price action in 2020 (blue areas).
Two out of three times China Deflation has been immediately positive for markets.
⚠️The most contentious period of deflation can be assigned to the 2000 Dot Com crash. The commencement of this 14 month period of deflation from October 2001 did not immediately mark the bottom. Instead the S&P500 made a further c.35% decline to gradually form its bottom over those 14 months ending in December 2002. If this was to repeat we could be looking at Sept 2024 as a possible market bottom and a 35% decline would be $2.9k for the S&P....👀
This scenario is worthy of consideration especially factoring in the comparisons of the 2023 AI boom to the 2000 internet boom. As we enter a new technological epoch with the likes of Augmented Reality, Cryptocurrencies and AI, are we getting ahead of ourselves again? Do these technologies need a little more time to mature much like the internet? Are we overextended like we were in 2000? Its hard to answer no to any of these questions but against the backdrop of record levels of QE and Fiscal Deficit we have to keep an open mind as we froth in record levels of liquidity.
What is useful about this chart is that if a 2000 Dot Com crash scenario was to play out from hereon, we could use China’s move back into inflationary territory (above 0% line) as a possible confirmation of a market bottom/reversal as was the case in Dec 2002.
What day is it? 🤣🤣🤣 I released this early brief Macro Monday as I seen this topic repeatedly in my feed today and wanted to share the perspective as soon as possible. There is a strong possibility of a 2nd alternative Macro Monday Chart on Monday 14th. Hope to see you there!
As always I hope the chart offers perspective and utility
PUKA

$CNIRYY - Deflationary CPI- While ECONOMICS:USIRYY numbers remain inflationary,
having the latest increase to 3.2% on August 10th,
on the other side of the World from the second Global Superpower,
ECONOMICS:CNIRYY came Deflationary at negative 0.3% on 9'th of August,
just a day prior to numbers of ECONOMICS:USIRYY .
Note that The Head of Federal Reserve,
our pal Jerome Powell,
stated that Feds do not see Inflation ECONOMICS:USIRYY coming down to their norm target of 2% CPI
by 2025.
Jerome still believes on a 'Soft Landing'..
How about another Joke, Powell !?
