Rarely have single family homes been so cheap.For gold stackers...
Rarely have single family homes been so cheap.
Key data points
Last release
—
Observation period
Jun 2025
Next release
—
Forecast
—
Highest
435.30 K USD on Jun 30, 2025
Lowest
19.70 K USD on Mar 31, 1968
About United States Single Family Home Prices
Single Family Home Prices in the United States refer to the median price for single-family and condos.
Related indicators
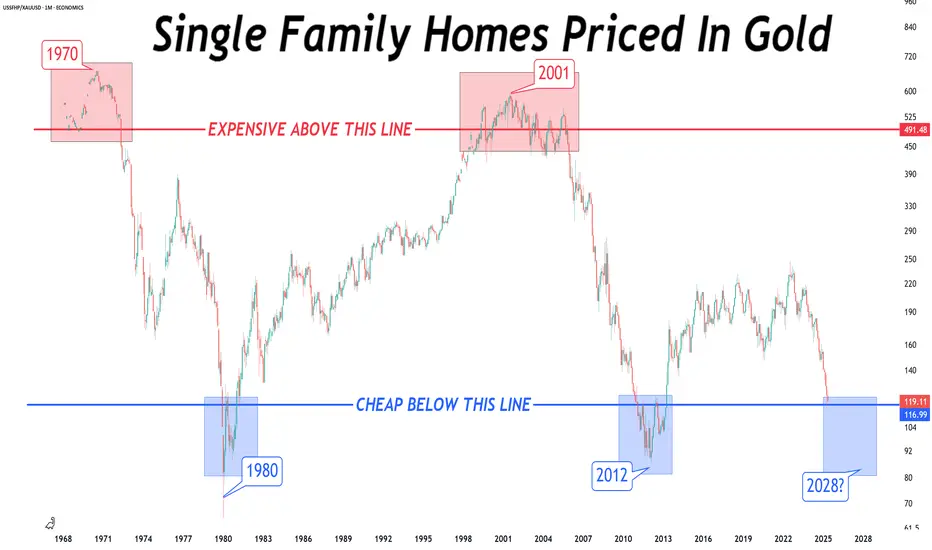
Homes Priced in GoldSingle family homes breaking down (in real terms).
Expecting another 30% drop from here.
You can't see this if you always price in fiat.

US HOUSING MARKET CRASHUS Real Estate Price Index Analysis:
The chart illustrates a long-term upward trend in the US real estate market, with prices consistently climbing over the years. However, we are now approaching a critical phase that requires close attention.
Pre-Election Period and Mid-2025 Outlook:
As we move t

🏘 Housing Bubble v 2.0: What Does It Mean for US Stock MarketMuch to the chagrin of would-be homebuyers, property prices just keep rising. It seems nothing - not even the highest mortgage rates in nearly 23 years — can stop the continued climb of home prices.
Prices increased once again in July, according to the latest S&P CoreLogic Case-Shiller home price

Single Family Homes priced in GoldFor OVER 50 years...
While a single family home denominated in #fiat has gone from bottom left to top right on the chart, it has remained in a sideways channel priced in #Gold.
Just another example how YOUR purchasing power is getting ERODED by #centralbanks and #governments.

house priced in fiat & silverWhat you see below is #centralbanks and #governments destroying YOUR purchasing power.
No reason a house should cost you that MUCH MORE than it did back in 1968.
Pricing things in #Gold and #Silver removes the #fiat currency illusion.

US Single Family Homes Cheap or Expensive?The "REAL" way to measure if US single family homes are cheap or expensive.
Right now, in perfect equilibrium.
Nominal US Single Family Home Index
Fair Value US Single Family Home (priced in gold)
#gold


Market Analysis: The Coming RecessionIn this post, I will present a market analysis with a focus on recession metrics and indicators. Right now, many of them are sending a recession warning.
Home Prices -
U.S. home prices are surging higher at the fastest quarterly rate of change on record. (See chart below)
This extreme rate of c

Real Estate Cycles: "down" 10 years then up 10 years?Looking to work on a model for real estate cycles.
Using median home prices divided by median income.
IYR REZ XHB

See all ideas