Rarely have single family homes been so cheap.For gold stackers...
Rarely have single family homes been so cheap.
USSFHP trade ideas
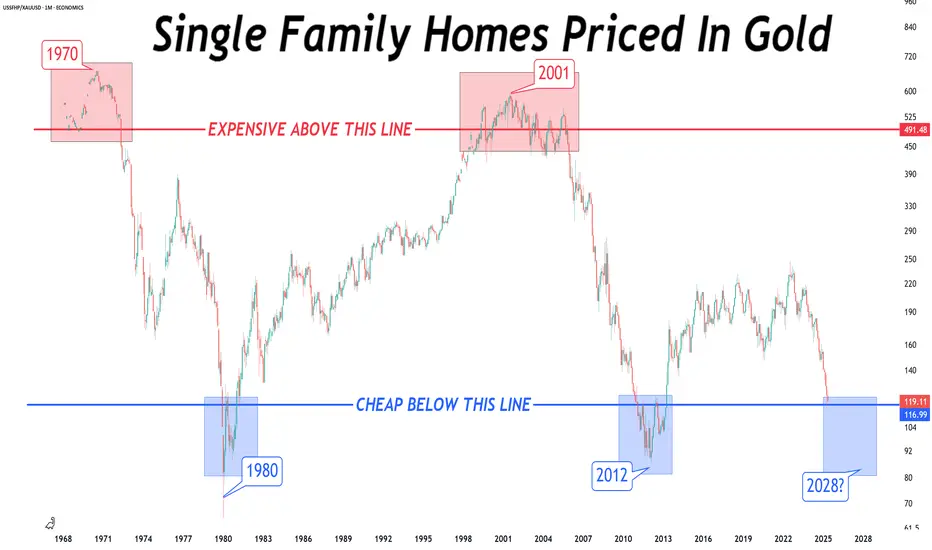
Homes Priced in GoldSingle family homes breaking down (in real terms).
Expecting another 30% drop from here.
You can't see this if you always price in fiat.

US HOUSING MARKET CRASHUS Real Estate Price Index Analysis:
The chart illustrates a long-term upward trend in the US real estate market, with prices consistently climbing over the years. However, we are now approaching a critical phase that requires close attention.
Pre-Election Period and Mid-2025 Outlook:
As we move towards the upcoming elections and into mid-2025, real estate prices in the US are expected to continue their ascent. This trend will be heavily influenced by consumer purchasing power and interest rates on loans, which individuals should monitor separately. The continued growth is driven by demand, but this is likely to face significant headwinds soon.
Impending Crisis in 2025:
As we enter 2025, the real estate market is on the brink of a major crisis. Prices are predicted to plummet, potentially falling to an average of $380,000 per home. If prices break below this level and sustain, we could see a further drop, possibly revisiting the 2020 price levels where the average home price ranged between $280,000 and $300,000.
Market Correction and Future Growth:
The market is expected to correct by approximately 30%, after which it should resume its growth trajectory. This correction will be tied to the growing unaffordability of new homes for the average family, as credit interest rates rise to levels beyond the reach of many. Consequently, more people will opt to rent rather than buy, leading to an oversupply in the market as homeowners struggle to keep up with mortgage payments.
With the increasing number of properties flooding the market and demand not keeping pace, the imbalance will push prices down. Additionally, global military conflicts and the policies of the Democratic Party, should they win the election again, will likely lead to a prolonged two-year recession from early 2025 to the end of 2026. Real estate will be one of the last sectors to recover from this crisis.
Strategic Buying Opportunity:
Given this outlook, I anticipate a market bottom by the end of 2026, making early 2027 the optimal time to purchase real estate in the US. This period should offer the best prices before the market stabilizes and begins its next growth phase.

🏘 Housing Bubble v 2.0: What Does It Mean for US Stock MarketMuch to the chagrin of would-be homebuyers, property prices just keep rising. It seems nothing - not even the highest mortgage rates in nearly 23 years — can stop the continued climb of home prices.
Prices increased once again in July, according to the latest S&P CoreLogic Case-Shiller home price index , with 19 out of 20 markets measured showing month-over-month gains. In another reflection of ongoing increases, the National Association of Realtors (NAR) says more than half of U.S. metro areas registered home price gains in the second quarter of 2023.
So much for the idea that a "housing recession" would reverse some of the outsized price gains in homes. The U.S. housing market had finally started slowing in late 2022, and home prices seemed poised for a correction. But a strange thing happened on the way to the housing crash: Home values started rising again.
NAR reports that median sale prices of existing homes are near record highs. Home prices in August 2023 rose 3.9 percent year-0ver-year to reach $407,100 — near the all-time-high of $413,800, and only the fifth time any monthly median has eclipsed the $400,000 mark since NAR began keeping records.
The housing recession is essentially over, or has just began!?
Home values have held steady even as mortgage rates have soared past 7 percent, reaching their highest level in more than 20 years in August. The culprit is a lack of housing supply. Inventories remain frustratingly tight, with NAR’s August data showing only a 3.3-month supply.
30-Year Fixed Mortgage Interest Rates Turn Higher, as 200-Month SMA Key Resistance was broken earlier in 2022.
Average Annual Mortgage Interest. 30 000 U.S. Dollars Rubicon is at the hands.
After the Federal Reserve’s meeting in June, Fed Chairman Jerome Powell told reporters he was keeping a close eye on the housing market.
"Housing is very interest-sensitive, and it’s one of the first places that’s either helped by low rates or held back by higher rates," - Powell said in the press conference.
"We’re watching that situation carefully."
Housing economists and analysts agree, regardless, that any market correction is likely to be a modest one. No one expects price drops on the scale of the declines experienced during the Great Recession.
Is the housing and stock markets are going to crash?
The last time the U.S. housing market looked so frothy was back in 2000s. Back then, home values crashed with disastrous consequences. When the real estate bubble burst, the global economy plunged into the deepest downturn since the Great Depression. Now that the housing boom is threatened by skyrocketing mortgage rates and a potential recession so buyers and homeowners are asking a familiar question: Is the housing market about to crash?
5 reasons ("cast in bronze") there will be no housing market crash
1. Inventories are still very low.
2. Builders didn’t build quickly enough to meet demand.
3. Demographic trends are creating new buyers.
4. Lending standards remain strict and impose tough standards on borrowers.
5. Foreclosure activity is muted: In the years after the housing crash, millions of foreclosures flooded the housing market, depressing prices, and it’s nothing like it was two decades ago.
Funny, but all of that adds up to the one only consensus: Yes, home prices are still pushing the bounds of affordability. But "Ooh not", this boom shouldn’t end in bust. 😏
History does not repeat itself. But often rhymes.
Technical graph for ECONOMICS:USSFHP - U.S. Single Family Home Prices illustrates there has been a while, without new all time highs in Top Four U.S. Stock market indices while Housing Bubble was exist in 2000s.
So lets see, will be the same in 2020s or not, while 2023 is a second straight year without new all time peaks in S&P500 SP:SPX , in Nasdaq-100 NASDAQ:NDX , in Dow Jones Index AMEX:DJIA as well as in Russell 2000 Index TVC:RUT

Single Family Homes priced in GoldFor OVER 50 years...
While a single family home denominated in #fiat has gone from bottom left to top right on the chart, it has remained in a sideways channel priced in #Gold.
Just another example how YOUR purchasing power is getting ERODED by #centralbanks and #governments.

house priced in fiat & silverWhat you see below is #centralbanks and #governments destroying YOUR purchasing power.
No reason a house should cost you that MUCH MORE than it did back in 1968.
Pricing things in #Gold and #Silver removes the #fiat currency illusion.

US Single Family Homes Cheap or Expensive?The "REAL" way to measure if US single family homes are cheap or expensive.
Right now, in perfect equilibrium.
Nominal US Single Family Home Index
Fair Value US Single Family Home (priced in gold)
#gold


Market Analysis: The Coming RecessionIn this post, I will present a market analysis with a focus on recession metrics and indicators. Right now, many of them are sending a recession warning.
Home Prices -
U.S. home prices are surging higher at the fastest quarterly rate of change on record. (See chart below)
This extreme rate of change in home prices is occurring as U.S. 30-year fixed mortgage rates also explode higher at nearly the fastest quarterly rate of change on record. (See chart below)
Additionally, we see in the chart below that 30-year fixed mortgage rates have potentially broken out into a new uptrend on the longer timeframes. The best way to detect trend reversals is by using the Ichimoku Cloud. When the price closes above or below the cloud (the shaded area) it is considered to have "pierced" the cloud. Once the cloud is pierced to the upside, resistance becomes support. In this case, assuming the piercing sustains, we can see a sustained period of higher interest rates on 30-year fixed mortgages.
Exploding home prices and exploding mortgage rates occurring simultaneously is unsustainable. Examine the yearly chart of U.S. home prices below and notice the similarities between 2005 and 2022. Notice that the Stochastic RSI is extended to the upside, and that home price extends above the upper Bollinger Band. Looking at this chart one could reasonably conclude that in the coming years home prices are likely to revert to the mean (orange line), as they did during the Great Recession.
Many analysts try to contradict what this chart is suggesting by claiming that we are in much better shape now than during the sub-prime mortgage crisis prior to the Great Recession. But are we really? With spiraling inflation, every mortgage holder suddenly becomes relatively more sub-prime. We also did not see mortgage rates explode then as quickly as they are now.
Unemployment -
Analysts point out that the current low unemployment is a reason to believe a recession can be averted. But under the surface, that's beginning to change in a hurry. Below is a chart of most leading unemployment data published by the Federal Reserve: Seasonally Adjusted Initial Claims (Weekly).
In this chart, we see that in about a period of the past 4 months, the amount of new unemployment claims has risen by around 100,000 or about a 50% increase. Compare this to the chart from the 2007-2008, when the U.S. economy was beginning to enter a recession (the shaded area represents where the recession began):
In the period leading up to the Great Recession, we saw a rise of about 50,000 new unemployment claims or about a 15% increase over a similar 4-month period. Therefore, the rate of increase of initial unemployment claims (both in real numbers as a percentage) is higher now than when we entered the Great Recession.
Perhaps more worrisome is the difference in how accommodative the Federal Reserve was in response to rising unemployment. Here is how the Fed Funds Rate changed as unemployment began to rise in late 2007 into 2008:
As unemployment was rising, the Federal Reserve began to cut interest rates. Compare this to the current situation in the below chart which shows the Federal Reserve raising interest while unemployment is rising. This change in context is reflective of both the fact that the Federal Reserve is behind the curve with containing inflation and the fact that the Federal Reserve is prioritizing the current problem (inflation) at the expense of the future problem (unemployment).
We are experiencing a macroeconomic situation whereby rapidly rising initial unemployment claims are being paired with rapidly rising interest rates. This combination is unlikely to end with any other outcome than a recession.
For more details on unemployment data see here: www.dol.gov
To interact with the initial unemployment claims data on a weekly basis you can go here: fred.stlouisfed.org
Yield Curve Inversion -
The 10-year minus the 2-year Treasury yield is used to detect an impending recession. When the 2-year yield rises above the 10-year yield that creates a yield curve inversion, which can often indicate that a recession is coming. Right now the yield curve inversion is very steep. In fact, just recently, the yield curve inversion actually steepened to a level that was even worse than what we saw before the Great Recession.
Perhaps most alarming are the rates of change in interest rates. Look at the 10-year yield Rate of Change on a 3-month basis:
Here's the 2-year yield rate of change:
The federal reserve uses the 10-year minus the 3-month as a more reliable indicator for detecting an impending recession than the 10-year minus the 2-year. However, the rate of change for the 10-year yield has been so parabolic to the upside that the 3-month yield has been struggling to invert relative to it. However, that may soon change. Here's the 10-year minus the 3-month yield chart:
Volatility -
As you know, volatility is measured by the VIX. The yearly Stochastic RSI for the VIX is trending upward, signally the potential for greater volatility now and throughout the years ahead.
This part is a little confusing, but try to follow if you can: Volatility of volatility is measured by the VVIX and is considered a leading indicator of the VIX. Currently, the VVIX is so suppressed to downside that the K value of the Stochastic RSI oscilator has reached zero for only the second time ever. (The first and only other time this has happened was in 2008). While this may be more coincidental than predictive, it nonetheless suggests that volatility of volatility has nowhere to go but up. See below.
Margin -
Margin has already unwinded both in real numbers and as a percentage by a magnitude that is consistent with, and usually only occurs during, a recession. See chart below.
Credit to Yardeni Research, Inc. You can view their full report here: www.yardeni.com
Stock Market -
Several bellwethers in the stock market are showing that, while we may have a robust rebound from extremely oversold levels in the short term, the longer timeframes look quite bearish, especially for the interest rate-sensitive tech and growth sectors.
For more details, here is my analysis on the QQQ/SPY relative performance:
Tech and growth are not alone in the bearish context. Indeed, the bull run from the end of the Great Recession to the current period has been characterized by increasing prices but decreasing volume. This is generally bearish, and may reflect that quantitative easing was a large cause of the bull run. Now, quantitative easing is ending in the face of spiraling inflation.
Other Metrics -
There are many other metrics that are used to detect recessions (e.g. GDP, PMI, M2V). Some may even look toward shifts in demographic trends, rising geopolitical tensions, declining globalization and climate change as recessionary factors. While I cannot discuss every possible metric, one last metric worth considering is the corporate bond market.
In 2020, during the COVID-19 shutdown, in order to stabilize markets, the Federal Reserve rushed in to save corporate bonds from crashing fearing that high borrowing costs for corporations could cause liquidity issues. Corporate liquidity issues can cause a whole host of issues from bankruptcies to layoffs. Currently, however, corporate bond prices have fallen to nearly that of the COVID low when the Federal Reserve rushed in to buy, yet the Federal Reserve is only just beginning quantitative tightening and just now beginning to roll bonds off its balance sheet.
Finally, I will leave you with this note: The time-tested winning strategy is to continue contributing as much as possible to your retirement fund. If the stock market crashes, do not stop or lower your contributions or try to pull money out because you think the world will end. Rather, continue to contribute as much as you can afford no matter what to a retirement mutual fund with diversified holdings. Contributions during market downturns will buy you more shares of your retirement mutual fund relative to the number of shares your contributions bought prior to the market crash. When price rebounds (and it will) you would have been glad to stick to this investment strategy.

Real Estate Cycles: "down" 10 years then up 10 years?Looking to work on a model for real estate cycles.
Using median home prices divided by median income.
IYR REZ XHB

US Real Estate in Massive BubblePrice of median US home as a multiple of median US household income. Biggest bubble in over 35 years!
Back to reality soon.

housing corrections since 2007analysis of US housing corrections since 2007. taking the standard deviation from the analysis we can predict where this current correction or possible crash will take us in price and in time.

10 Charts You Must See#10 Mortgages
The chart below shows the average single-family U.S. home price multiplied by the 30-year fixed mortgage rate. This chart attempts to show how dramatically higher the financial burden of home ownership has become in the United States. Using a cross chart allows us to better visualize the rate of change. Each cross represents one month.
We can see that the current situation looks even more drastic than the subprime mortgage crisis that preceded the Great Recession. Although wages are rising, the rate of change in the cost of home ownership is rising much faster. In this regard, one may conclude that extreme inflation in home prices coupled with a rapidly rising mortgage rates makes every borrower today subprime.
#9 Tech Bubble
The yearly chart below shows the ratio between tech's performance (QQQ) and the performance of the S&P 500 (SPY). Notice that in 2020 and 2021 tech tried but was unable to close above the peak before the Dotcom Bust. Tech stocks then crashed in the first half of 2022.
Take a look at the yearly (or semi-yearly) Stochastic RSI oscillators in the series of relative charts below.
Could these charts suggest that Microsoft is about to underperform the Nasdaq for years, that the Nasdaq in turn may underperform the S&P 500 for years, that the S&P 500 in turn may underperform Gold for years, and that Gold may underperform U.S. Treasuries on the 6-month timeframe? Using oscillators in this manner is limitedly valid but one may ponder what these charts say about the future. A shift of investment allocation in this manner typically occurs during a financial crisis. For those who may not already be familiar, check out Exter's Pyramid below.
During financial crises market participants typically flee the riskier assets near the top of the inverted pyramid due to these assets' vulnerability to default. Simultaneously, market participants accumulate the more secure and tangible assets lower on the inverted pyramid.
This is not a trade or portfolio reallocation recommendation. The QQQ/SPY chart is adjusted for dividends. The GOLD/TLT chart is on a 6M rather than yearly chart merely because not enough data exists to generate a Stochastic RSI on the yearly level.
#8 Japan's Debt
Although what you see below may look like a single chart of a bell curve, it is actually two charts placed side-by-side.
On the left side is a quarterly chart of the balance sheet of Japan's central bank. As you can see, the amount of Yen on the central bank's balance sheet is trending up toward one quadrillion.
In contrast, on the right side is a chart that shows the amount of gold that each Japanese Yen can purchase. As you can see, the amount of Gold that a single Japanese Yen can purchase is quickly approaching zero.
Smoothened moving averages were used to generate these charts to simplify and enhance the visualization of trends.
#7 Crypto Winter
The below yearly chart shows the equation 1/BTCUSD, which mathematically represents how much Bitcoin a single U.S. dollar can buy, (or simply USD/BTC).
Despite having major “crypto winters” about once every several years, the amount of Bitcoin that one fiat U.S. dollar can buy continues to trend endlessly toward zero (not much unlike the Yen to Gold chart above). The U.S. dollar loses value over time as more and more dollars are created, which must always continue in a debt-based economy.
During periods when the Federal Reserve tightens the money supply, the rise in the U.S. dollar’s value relative to Bitcoin is barely noticeable in the chart, even when log-adjusted. Next time someone tells you that Bitcoin is going to zero show them this chart, which technically shows that the exact opposite is more true.
This is not trading or investment advice, Bitcoin and all intangible cryptocurrency assets are highly volatile. You can lose a lot or all of your money trading or investing in these assets.
#6 Dollar Index
As the below chart shows, the dollar index appears be breaking out of a yearly bull flag and breaking above the yearly exponential moving averages (EMA) ribbon for the first time ever.
If this trend continues, what economic consequences might this have?
The Dollar Milkshake Theory attempts to answer that question: www.youtube.com
#5 Shiller PE Ratio
The Shiller PE Ratio is often used as a measure of stock market valuation. The below chart shows that stocks are so overvalued that even after one of the worst first halves of the year in stock market history, stock valuations have merely come down to the same level as the peak before the Great Depression.
#4 Stock Market Channel
The below stock market channel was created by me using a series of regression lines based on standard deviation from the mean price of the entire history of the S&P 500.
As the charts show, the S&P 500 is near record levels above the mean even after the selloff during the first half of 2022.
#3 Cost of Debt
The below chart attempts to illustrate the cost to the United States of servicing its debt (i.e. interest payments). More specifically, the chart shows the monthly rate of change for the equation of total public debt multiplied by the Fed Funds rate (as a decimal).
As you can see, we've never seen an explosive jump in the monthly rate of change in debt service to this degree ever since data became available about 55 years ago.
This chart was introduced to me by @prd001 . It is unscientific and is a mere thought experiment. For official, but lagging, data you can view the Federal Reserve's data on interest payments (Symbol: A091RC1Q027SBEA).
#2 Monetary Easing
The below chart attempts to illustrate just how unprecedented monetary easing is. It provides a visual representation of the total assets on the government's balance sheet as a percentage of nominal GDP. It uses the Bank of England's balance sheet because it provides the most reliable comprehensive records since 1700. The chart then superimposes the Federal Reserves' assets (relative to the U.S. nominal GDP) in the present-day to illustrate the fact that at no point over the past 322 years has such a large amount of assets, as a percentage of nominal GDP, been the norm.
Monetary easing is therefore a modern economic experiment. How might it end?
#1 Climate Change
This chart is so consequential that it has led to the creation of a new epoch in human existence: the Anthropocene Epoch. The chart shows the meteoric rise of carbon dioxide in the earth's atmosphere.
Here are some video you should watch:
Climate Spiral: www.youtube.com
Carbon Dioxide Pump Handle: www.youtube.com
If there is one chart that all future generations will attribute to everyone living today, it is this.

Home Prices compared to GDP Gdp may be slowing down and therefore could be signaling high home valuations.
$iyr $rez $xhb $xlre $hd $wmt $copper $lumber $mortgages
