Are you Edge'ing decision time curling up big time tight SL JUST for my practice purpose NFA LETS SEE WHERE IT GOES
Related pairs

$EDGE Rejection at 50-EMA – Short the Bounce!Analysis: CBOE:EDGE was rejected at the 50-period EMA ($0.0655) on the 4H chart, forming a bearish pinbar. RSI is at 50, and MACD is crossing bearish. A move lower could test $0.0610 (Fib 0.618). Volume is low, suggesting weak buying pressure.
Trade Setup:
Entry: $0.0648
Stop Loss: $0.0660 (a

$EDGE Bearish Wedge Breakout – Short Now!Analysis: CBOE:EDGE broke below a rising wedge on the 1H chart at $0.0645, with a bearish MACD crossover. RSI is at 45, with downside potential to $0.0600 (next support). Volume spiked on the break, confirming bearish pressure.
Trade Setup:
Entry: $0.0643
Stop Loss: $0.0655 (above wedge)
T
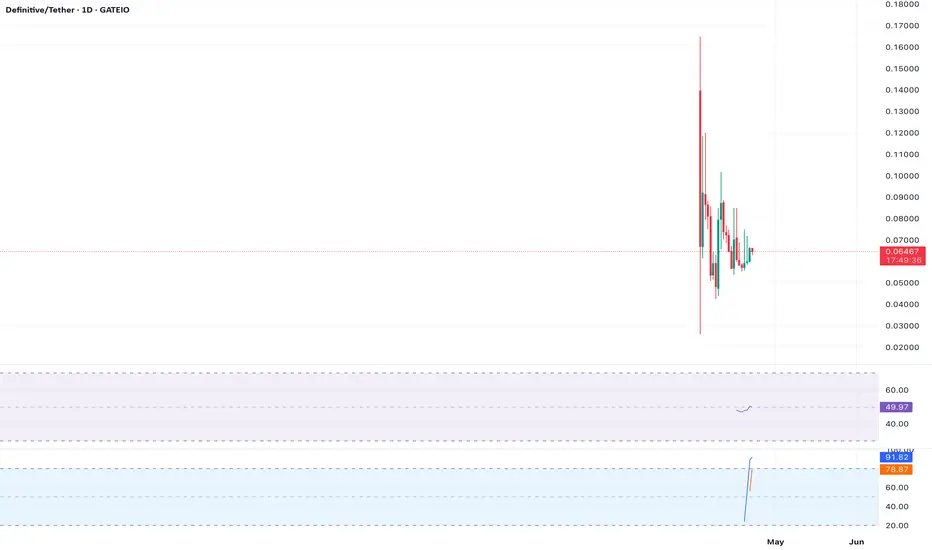
$EDGE Double Top at $0.0690 – Short the Rejection!Analysis: CBOE:EDGE formed a double top at $0.0690 on the 4H chart, with RSI showing bearish divergence at 70. A break below $0.0640 (neckline) could target $0.0590 (measured move). Volume is decreasing, indicating fading bullish momentum.
Trade Setup:
Entry: $0.0638 (below neckline)
Stop Los

$EDGE Bearish Channel Break – More Downside Ahead?Analysis: CBOE:EDGE broke below a bearish channel support at $0.0640 on the daily chart, with a failed retest at $0.0645. MACD is bearish, and RSI is at 42, with room to fall. The next support is at $0.0580. Volume spiked on the breakdown, confirming seller pressure.
Trade Setup:
Entry: $0.0642

$EDGE Overbought RSI – Pullback Incoming?Analysis: CBOE:EDGE rallied to $0.0670 on the 4H chart, but RSI is at 78, indicating overbought conditions. A bearish divergence is forming, and the price is near a Fib 1.0 extension. Expect a retracement to $0.0620 (50-period EMA). Volume is declining post-spike.
Trade Setup:
Entry: $0.0665

$EDGE Testing Trendline Resistance – Fade the Rally?Analysis: CBOE:EDGE is hitting a descending trendline resistance at $0.0660 on the 1H chart. A bearish MACD crossover and RSI at 64 suggest weakening momentum. A rejection could push the price to $0.0610 (next support). Volume is flat, showing low buyer conviction.
Trade Setup:
Entry: $0.0655 (o

$EDGE Head and Shoulders Signals Downside! Analysis: CBOE:EDGE is forming a head and shoulders on the daily chart, with the neckline at $0.0630. The head peaked at $0.0700, and RSI is declining from 68. A break below $0.0630 could target $0.0580 (measured move). Volume is dropping, suggesting fading bullish pressure.
Trade Setup:
Entry:

$EDGE Rejected at $0.0680 – Short Setup Forming?Analysis: CBOE:EDGE faced rejection at $0.0680 (Fib 0.786) on the 4H chart, forming a bearish engulfing candle. RSI is overbought at 72, signaling a potential pullback to $0.0620 (50-period EMA). Volume is fading post-rejection, indicating weak bullish momentum.
Trade Setup:
Entry: $0.0675 (belo

$EDGE Reversal at Strong Support – Long Opportunity!Analysis: CBOE:EDGE bounced off a major support at $0.0600 on the daily chart, aligning with the 200-day SMA and a bullish RSI divergence (oversold at 30). A double bottom is forming, suggesting a reversal. A move above $0.0660 could target $0.0750 (previous high). Volume is increasing, supporting

See all ideas
Summarizing what the indicators are suggesting.
Oscillators
Neutral
SellBuy
Strong sellStrong buy
Strong sellSellNeutralBuyStrong buy
Oscillators
Neutral
SellBuy
Strong sellStrong buy
Strong sellSellNeutralBuyStrong buy
Summary
Neutral
SellBuy
Strong sellStrong buy
Strong sellSellNeutralBuyStrong buy
Summary
Neutral
SellBuy
Strong sellStrong buy
Strong sellSellNeutralBuyStrong buy
Summary
Neutral
SellBuy
Strong sellStrong buy
Strong sellSellNeutralBuyStrong buy
Moving Averages
Neutral
SellBuy
Strong sellStrong buy
Strong sellSellNeutralBuyStrong buy
Moving Averages
Neutral
SellBuy
Strong sellStrong buy
Strong sellSellNeutralBuyStrong buy
Frequently Asked Questions
The current price of Definitive/Tether (EDGE) is 0.06963 USDT — it has fallen −5.19% in the past 24 hours. Try placing this info into the context by checking out what coins are also gaining and losing at the moment and seeing EDGE price chart.
Definitive/Tether price has fallen by −22.35% over the last week, its month performance shows a −42.37% decrease, and as for the last year, Definitive/Tether has decreased by −50.14%. See more dynamics on EDGE price chart.
Keep track of coins' changes with our Crypto Coins Heatmap.
Keep track of coins' changes with our Crypto Coins Heatmap.
Definitive/Tether (EDGE) reached its highest price on Apr 2, 2025 — it amounted to 0.16500 USDT. Find more insights on the EDGE price chart.
See the list of crypto gainers and choose what best fits your strategy.
See the list of crypto gainers and choose what best fits your strategy.
Definitive/Tether (EDGE) reached the lowest price of 0.02603 USDT on Apr 2, 2025. View more Definitive/Tether dynamics on the price chart.
See the list of crypto losers to find unexpected opportunities.
See the list of crypto losers to find unexpected opportunities.
The safest choice when buying EDGE is to go to a well-known crypto exchange. Some of the popular names are Binance, Coinbase, Kraken. But you'll have to find a reliable broker and create an account first. You can trade EDGE right from TradingView charts — just choose a broker and connect to your account.
Definitive/Tether (EDGE) is just as reliable as any other crypto asset — this corner of the world market is highly volatile. Today, for instance, Definitive/Tether is estimated as 8.04% volatile. The only thing it means is that you must prepare and examine all available information before making a decision. And if you're not sure about Definitive/Tether, you can find more inspiration in our curated watchlists.
You can discuss Definitive/Tether (EDGE) with other users in our public chats, Minds or in the comments to Ideas.