Are you Edge'ing decision time curling up big time tight SL JUST for my practice purpose NFA LETS SEE WHERE IT GOES
EDGEUSDT trade ideas

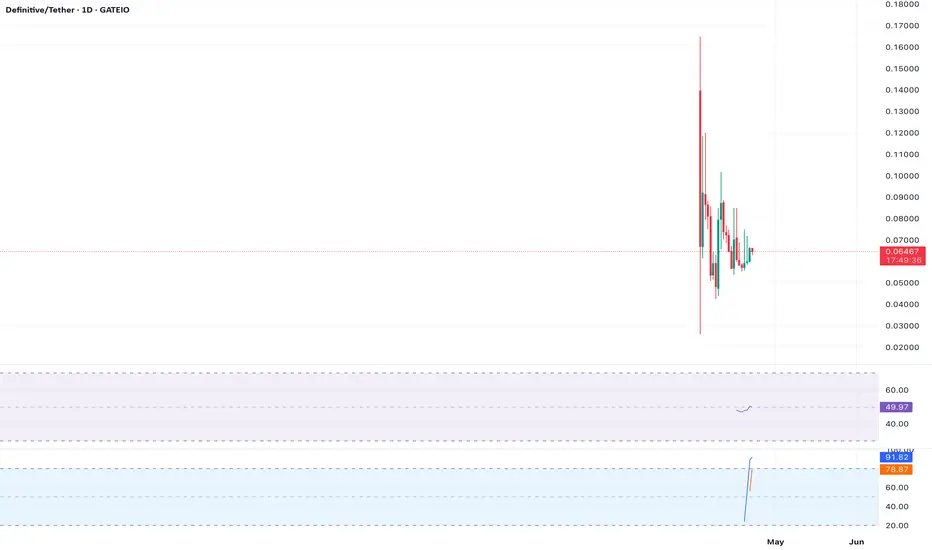
$EDGE Rejection at 50-EMA – Short the Bounce!Analysis: CBOE:EDGE was rejected at the 50-period EMA ($0.0655) on the 4H chart, forming a bearish pinbar. RSI is at 50, and MACD is crossing bearish. A move lower could test $0.0610 (Fib 0.618). Volume is low, suggesting weak buying pressure.
Trade Setup:
Entry: $0.0648
Stop Loss: $0.0660 (above EMA)
Take Profit: $0.0620–$0.0610
Risk-Reward: 1:2
Note: Confirm with a 4H bearish candle. Use tight stops for this quick trade. #EDGE #EMA #Short

$EDGE Bearish Wedge Breakout – Short Now!Analysis: CBOE:EDGE broke below a rising wedge on the 1H chart at $0.0645, with a bearish MACD crossover. RSI is at 45, with downside potential to $0.0600 (next support). Volume spiked on the break, confirming bearish pressure.
Trade Setup:
Entry: $0.0643
Stop Loss: $0.0655 (above wedge)
Take Profit: $0.0610–$0.0600
Risk-Reward: 1:2
Note: Enter on a 1H bearish candle. Scalp cautiously in volatile conditions. #EDGE #Wedge #Bearish
$EDGE Double Top at $0.0690 – Short the Rejection!Analysis: CBOE:EDGE formed a double top at $0.0690 on the 4H chart, with RSI showing bearish divergence at 70. A break below $0.0640 (neckline) could target $0.0590 (measured move). Volume is decreasing, indicating fading bullish momentum.
Trade Setup:
Entry: $0.0638 (below neckline)
Stop Loss: $0.0650 (above double top)
Take Profit: $0.0600–$0.0590
Risk-Reward: 1:2.5
Note: Wait for a 4H close below $0.0640. Low-cap tokens can pump unexpectedly, so stay cautious. #EDGE #DoubleTop #Short

$EDGE Bearish Channel Break – More Downside Ahead?Analysis: CBOE:EDGE broke below a bearish channel support at $0.0640 on the daily chart, with a failed retest at $0.0645. MACD is bearish, and RSI is at 42, with room to fall. The next support is at $0.0580. Volume spiked on the breakdown, confirming seller pressure.
Trade Setup:
Entry: $0.0642 (post-retest)
Stop Loss: $0.0650 (above channel)
Take Profit: $0.0600–$0.0580
Risk-Reward: 1:3
Note: Confirm with a daily close below $0.0640. Watch broader market sentiment. #EDGE #Breakdown #Bearish

$EDGE Overbought RSI – Pullback Incoming?Analysis: CBOE:EDGE rallied to $0.0670 on the 4H chart, but RSI is at 78, indicating overbought conditions. A bearish divergence is forming, and the price is near a Fib 1.0 extension. Expect a retracement to $0.0620 (50-period EMA). Volume is declining post-spike.
Trade Setup:
Entry: $0.0665
Stop Loss: $0.0675
Take Profit: $0.0630–$0.0620
Risk-Reward: 1:2
Note: Short on a bearish 4H candle. Always use a stop-loss in volatile crypto markets. #EDGE #RSI #Short

$EDGE Testing Trendline Resistance – Fade the Rally?Analysis: CBOE:EDGE is hitting a descending trendline resistance at $0.0660 on the 1H chart. A bearish MACD crossover and RSI at 64 suggest weakening momentum. A rejection could push the price to $0.0610 (next support). Volume is flat, showing low buyer conviction.
Trade Setup:
Entry: $0.0655 (on rejection)
Stop Loss: $0.0665 (above trendline)
Take Profit: $0.0620–$0.0610
Risk-Reward: 1:2
Note: Enter on a bearish 1H candle at resistance. Monitor for quick reversals. #EDGE #Trendline #Bearish

$EDGE Head and Shoulders Signals Downside! Analysis: CBOE:EDGE is forming a head and shoulders on the daily chart, with the neckline at $0.0630. The head peaked at $0.0700, and RSI is declining from 68. A break below $0.0630 could target $0.0580 (measured move). Volume is dropping, suggesting fading bullish pressure.
Trade Setup:
Entry: $0.0625 (below neckline)
Stop Loss: $0.0640 (above right shoulder)
Take Profit: $0.0590–$0.0580
Risk-Reward: 1:2.5
Note: Confirm the break with a daily close. Low-cap tokens can be volatile, so use stops. #EDGE #H&S #Short

$EDGE Rejected at $0.0680 – Short Setup Forming?Analysis: CBOE:EDGE faced rejection at $0.0680 (Fib 0.786) on the 4H chart, forming a bearish engulfing candle. RSI is overbought at 72, signaling a potential pullback to $0.0620 (50-period EMA). Volume is fading post-rejection, indicating weak bullish momentum.
Trade Setup:
Entry: $0.0675 (below engulfing low)
Stop Loss: $0.0685 (above resistance)
Take Profit: $0.0630–$0.0620
Risk-Reward: 1:2
Note: Look for a 4H bearish confirmation candle. Scalp cautiously in choppy markets. #EDGE #Bearish #Reversal

$EDGE Reversal at Strong Support – Long Opportunity!Analysis: CBOE:EDGE bounced off a major support at $0.0600 on the daily chart, aligning with the 200-day SMA and a bullish RSI divergence (oversold at 30). A double bottom is forming, suggesting a reversal. A move above $0.0660 could target $0.0750 (previous high). Volume is increasing, supporting the bullish case.
Trade Setup:
Entry: $0.0665 (above neckline)
Stop Loss: $0.0590 (below support)
Take Profit: $0.0730–$0.0750
Risk-Reward: 1:2.8
Note: Confirm with a daily close above $0.0660. Manage risk to avoid fakeouts in low-cap tokens. #EDGE #DoubleBottom #Long

$EDGE Bullish Breakout Above Resistance – Ready to Surge?Analysis: CBOE:EDGE is breaking above a key resistance at $0.0650 on the 4H chart, forming a bullish pennant after a rally from $0.0600. The 50-period EMA ($0.0625) is acting as support, with rising volume confirming buyer interest. RSI is at 58, indicating room for upside. A breakout could target $0.0720 (Fib 1.618 extension).
Trade Setup:
Entry: $0.0655 (post-breakout)
Stop Loss: $0.0620 (below EMA)
Take Profit: $0.0700–$0.0720
Risk-Reward: 1:2.5
Note: Wait for a 4H close above $0.0650 to confirm. Use tight stops due to crypto volatility. #EDGE #Bullish #Breakout
