Elliot waves on ELROND\USD pairOn the 2-week chart, we can see that the bullish cycles repeat for 9 bars (126 days),
and that the bearish cycles repeat for 6 bars (84 days) (approximate values).
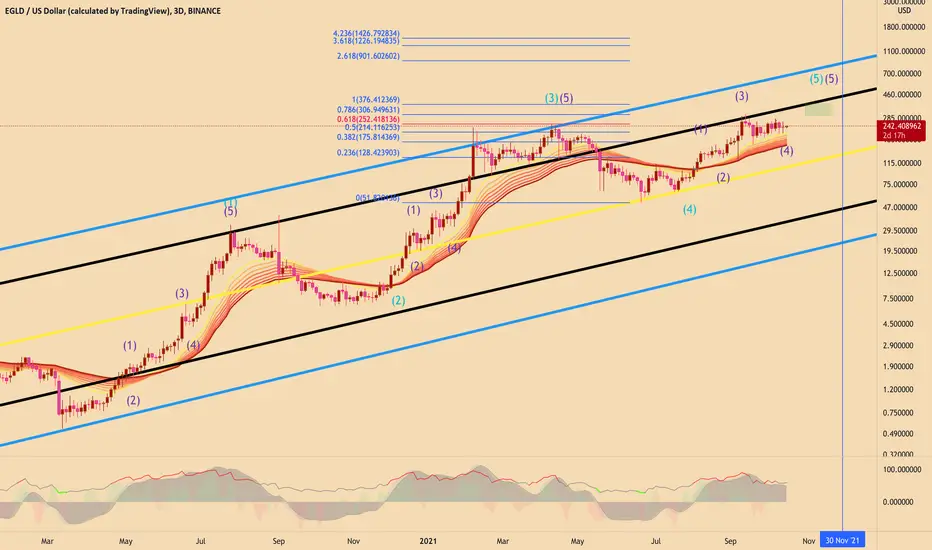
If we trace the Elliot waves, we can identify that we are on wave 5.
If the bull cycle takes place at the same periodicity, we can assume that the price will reach U$ 496 at the end of November.
And a possible corrective wave ABC could form by the end of February.
EGLDPERP trade ideas

EGLD: target 1250$ (0.886 FIB LEVEL)In my previous idea about schiff pitchforks i estimated 1150$ using FIB retracements.
This idea uses FIB extensions in logarithmic fashion, as well as axis. In this way, no more 6.618 madness shows there.
I added 0.886 which represents the price level derived from the golden ratio (0.618 x 0.618=0.786, 0.786 x 0.786 = 0.886). You can see that was the target in the previous run... right?
Between 30 Nov and Feb 2022 is my bet.
Let me know what you think, now that MAIAR DEX is about to happen.

EGLD: some lines to look atI had a look this time at lines that could be there. Now that Maiar DEX is coming out in November, i think the blue trend is the one that should hold, but let see.

EGLD: two fractals optionsThese are the two options i am seing in the short term, looking at possible fractals (see my other posts)
1) we go sideways for about 10d, then we continue up.
2) We are rejected in 0.618 of the last retracement (where we currently are) and we go down to around 155 usd.

EGLD Ascending Triangle Tracing a fibonacci retracement we see that the main targets of the ascending triangle coincide with point 1 fibonacci and 1.618 and also with the pivot points.
If the news of the Dex arrives early next week, I believe we will have enough volumes to support this price growth.
Even the indicators do not look bad, the RSI is at 56.84 on the Daily, and it still has a lot of room for growth and the MACD if supported by growing volumes will make the bullish cross.

EGLD Wave 5 $375Used fibs and wave analysis to determine HTF and LTF impulse waves. A couple potential 5's ending, putting the peak at $370. Feedback appreciated!
EGLD going to $4000?!EGLD is nicely following an upward channel that can hint us the next targets for this coin in long term up to about $4000.
Do Dollar-cost averaging and buy this coin.
Muneeb

EGLD: only bearish scenario (if BTC dumps suddenly)We need to be also ready for this, if it happens.
EGLD forming a ascending wedge, that is usually bearish. If BTC tops soon after the long rally, it could happen. Be prepared for all chances...


WHY 100% bull market? Let me show you EGLD, BTC.D & more (PT.1)In this first video, I'm going to show you why we are 100% in a bull market and why altcoins are going parabolic in October and maybe early november.
It's easy:
- look at the overall structure of the charts
- look at the moving and exponential moving averages daily crossing
- look at the weekly charts
Also, I'm speaking about a new scenario when it comes to the bull market which I called "the DOLLAR scenario". It will be discussed in Pt.2


EGLD 3 month predictionELGD trend is looking too perfect. We can see we are a little bit higher than the support. And look at the RSI ! It is so accurate. I feel it is a little bit to good to be true... A x10 or x20 is possible...
What do you think ?

EGLD / US dollar. Important chart !!Hello traders, I don't put any suggestion for the futur of EGLD price.
But I know that Elrond Teams want to present lots of idea for the next week.
God day.


EGLDUSD | DOUBLE TOP | BEARISH DIVERGENCE ON RSIEGLDUSD just formed a bearish divergence on the 4H TF on the RSI and a double top chart pattern. Technically this is a bearish sign and a possible trend reversal signal BUT we are still in a bullish trend on EGLDUSD.
Wait for neckline break and a close of 4h candle below it to enter a short trade (potential fakeout, bigger R:R ratio)
or...
wait for the re-test of the neckline once it is broken and then look for a bearish candle formation or trend line break on the 1H TF. (safer option, sometimes smaller R:R)
TP1: 180
TP2: 160
TP3: ??
good luck!

[UPDATE EGLD] Consolidation confirmed until Aug until then PUMP.If Bitcoin follows my scenarios, EGLD could start the pump again in AUG 2021.
Great opportunity to accumulate:
Technical analysis:
- Crashed 80% from the all-time high
- Re-tested the 1,61 Fib (great support)
- Tested the macro ascending channel (great support)
- Super trend indicator in line with the previous cycles (great support)
- Bullbear trend and stochastic RSI on the weekly are at the minimum levels.
Fundamental analysis:
- Drop of the Maiar exchange and Mex are imminent and will go online in July.
- Community is growing daily
- Team super professioal
- Great tokenomics
EGLD is behaving like a mini BTC. I guess we could have decreasing returns for the next pump.

EGLD Price Fractals: Ready To Fly !Here's a comprehensive analysis on EGLD performed on a weekly time-frame and we will observe how the prices exhibit fractal properties over time. Also, we'll speculate upon the factors (listed below) which will lead the price to it's next possible New All-Time-High (ATH).
(i) The price momentum has been developing inside an "ASCENDING CHANNEL" since Dec 2019, with the middle line acting both, resistance and support throughout the course inside the channel and after the breakout from the middle line of the channel the price has repetitively surged towards it's ATH.
(ii) The Important Fibonacci Levels for every cycle seems to be the 0.382 level at which the prices retraces back after forming a new ATH.
(iii) After making an ATH, the price retraces and everytime the prices tests the Lower Trendline of the channel the demand pushes the price back to the upside with exceptionally strong momentum which unfolds the discovery of new ATH.
This type of extensive analysis is more of a speculation of the price development rather than prediction of price projected in the future.
Feel free to share your thoughts and your targets for EGLD in the comments below.

EGLD schiff forks: 1150$ targetIf we try to use Schiff Forks on the previous run and current one looking for confluences, and we do the same with FIB retracements, this is what we see in the logarithmic scale.
It is good to be prepared if it can happen, so don't sell all your EGLD at 200$ :)


EGLDUSD - Finishing the 3rd waveHi and welcome back to my analysis channel. It's been a while since I posted my last trading idea and I would like to sart with EGLD since the chart says to us that we should close some positions because wave III is ending its formation soon. The next step is wave IV that will make a correction in the range between 130-160, after which we will be able to enter the 5th wave rally to gain bigger profits.
--------------------------------------------------------------------------------------
The wave V has 2 ways of growth. First one reaches the 200 dollars resistance level, since according to Elliott Waves Theory, the extension in 3rd wave determine approximately the same size of waves 1 and 5
The alternative count says that wave V could reach 1.618 of w3, which is less probable. I think in this case we should follow some fundamentals in order to see if the EGLD has a basis strong enough to break some key levels and to grow bigger than the perfectly formed 3rd wave.
Thus the clearer image will be available at the start of that 5th wave
--------------------------------------------------------------------------------------
I would also like to notice that the purple arrows you see where a prediction made by me without publishing it here. This is a good example of how useful can Elliott Waves Theory(EWT) be in predicting market moves.
Good luck in your trading / investment decisions guys. Like / comment / share to support my ideas if you like them
stay tuned ;)

$EGLD on its way to the 200's After some time consolidating right over the 200sma on the daily it's looking ready for a crack at the 200's. It's after $240 when things get interesting $$$

EGLD/USDT Road to ?Voici ce que je pense concernant BINANCE:EGLDUSDT .
TP Long therme à 1338$ dans la zone entre 833$ (2.618) et 1726$ (3.618) pour ensuite avoir un retracement au niveau des 4.618 (568$) de l'ancien cercle fibonacci.
Attention sur ce bull run crypto car les cycles pourraient s'essouffler donc gardez une infime partie de vos positions.
Et vous que pensez-vous ?
--------------------------------------------------------------------
Here is what I think regarding BINANCE:EGLDUSDT .
TP Long therme at $ 1338 in the area between $ 833 (2.618) and $ 1726 (3.618) to then have a retracement at the level of 4.618 ($ 568) of the old fibonacci circle.
Be careful on this crypto bull run because the cycles could run out of steam so keep a tiny part of your positions.
And you what do you think?
