EGLDUST trade ideas

#EGLD, About to print a new 2D Buy 😏#EGLD
About to print a new 2D Buy 😏
aiming for a breakout above the high of the most recent two-month range

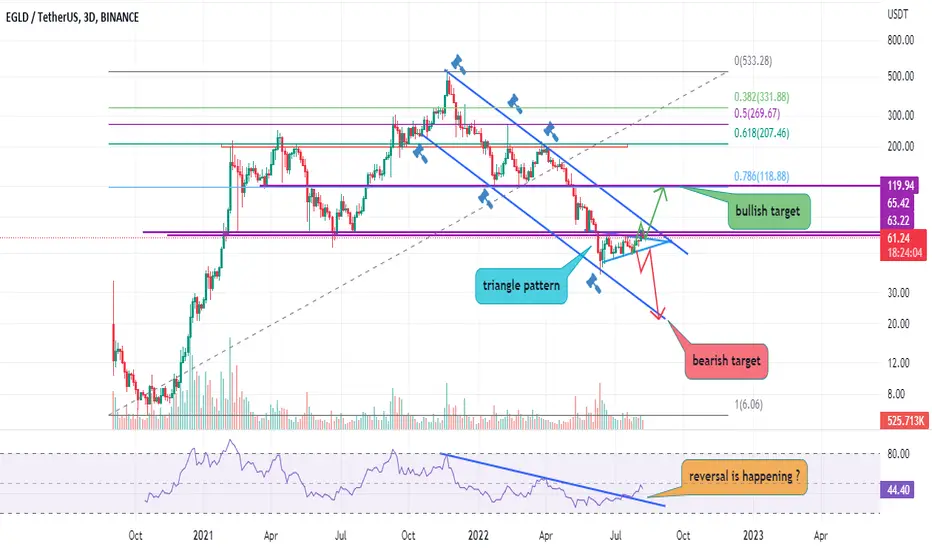
bearish continuation pattern or trend is about to change ?Hello traders 🐺 .
In the chart above we can see two different probable scenario for the EGLD , but in my opinion because of the market situation there is more chance to break the triangle toward the upside and touch the bullish price target ; because as you can see RSI is trying to goes above the 50 and change the mode of the price to the bullish .
the first resistance for the price is around the daily descending channel but if price break above it , we could expect to test the 0.786 Fibonacci level .
if EGLD break this triangle toward the downside the first support level is around the previous low and if bears succeed to push the price lower we can expect another retest of the lower trend line of the channel .
Good luck my friends 😉🐺 .
EGLDUSDT ButterflyButterfly
The Butterfly Pattern is a distinct 5-point extension structure that was discovered by Bryce Gilmore and further defined by Scott Carney. It has specific Fibonacci measurements for each point within its structure and it is important to note that D is not a point, but rather a zone in which price is likely to reverse, called the Potential Reversal Zone (PRZ). The B point retracement of the primary XA leg lies at 0.786 and the PRZ consists of 3 converging harmonic levels: 1) 1.27 extension of the primary XA leg, 2) AB=CD pattern, either equivalent or 1.27 and 3) Extreme BC projection of 2.00, 2.24 or 2.618.
The first target would be the 382 retracement of AD and the second target the 618 retracement of AD. Common stop levels lie behind the next structure level after the D point or the 1.41 extension of XA. Conservative traders look for additional confirmation. These patterns can be bearish and bullish. TradingView has a smart XABCD Pattern drawing tool to visually identify 5-point reversal structures.

EGLDUSDT is creating a penanntthe price had a nice breakout from the daily resistance and now the market is testing the 4h resistance at 67.7$ area.
the price retested the daily resistance as new support on 64$ area
How to approach it?
IF the price is going to have a new breakout from the 4h resistance and retest it as new support, According to Plancton's strategy , we can set a nice order
–––––
Keep in mind.
🟣 Purple structure -> Monthly structure.
🔴 Red structure -> Weekly structure.
🔵 Blue structure -> Daily structure.
🟡 Yellow structure -> 4h structure.
–––––
Follow the Shrimp 🦐

EGLD breakout - potential long on the flagI opened my 4th trade this week on EGLD on a bullish structural breakout. It's in profit at the moment.
65 entry for the long
55 SL (but close earlier if btc turns)
100 area target.
67 resistance, 63 support areas to watch.
Play the price action.

Elrond EGLD short Entry Range, Take Profit and Stop LossEGLD/USDT short
Entry Range: $65 - 69
Price Target 1: $59
Price Target 2: $49
Price Target 3: $39
Stop Loss: $79

EGLD/USDTEGLD/USDT
It is in a descending channel that has broken its $60 resistance.
The desired goals are specified in the image.
be profitable
#EGLDUSDT #EGLD #BTCUSDT #BTC #ETHUSDT #DOGE #DOGEUSDT

EGLD possible scenario hello guys , egld breaked stronge supply zone and looks like it gonna pull back to that zone , if we get confimation we can have that scenario , comment below your idea guys ... PEACE

EGLDHELLO guys this is my analysis about EGLD
if you like my work please like follow and share 😀
Thank you Turtle Trader 🐢


EGLDUSDT | RESISTANCE ZONEEGLDUSDT has broken the falling resistance but price has hit the horizontal resistance and took a beat. We are expecting a price fall from here. The retest of resistance zone will be a good zone to take a short position.
The bears are in control below the resistance zone. While bulls needs to break above the resistance zone.
Trade your levels accordingly.

EGLD/USDT breakout of triangleBreakout of symmetrical triangle could lead to the height of triangle. Growth to 80$ expected;)

#EGLD #ELROND HVF heading to low - mid $70'sA nice HVF is forming on Elrond
Patern triggers at $60
Stop at $54
early entries could be rewarded here.
@TheCryptoSniper

EGLDUSDT on Resistance 3rd timeEGLDUSDT is present on this resistance price level of 59-60 3rd time to cross this level making the resistance easy to break so we can observe an upward ride

EGLDUSDTHello Crypto Lovers,
Mars Signals team wishes you high profits.
This is a 4-hour-time frame analysis for EGLDUSDT
Here we have R2 and R1 as our resistance areas and the unsuccessful attempts of the price to rise is obvious. And S1 is the support area which represents the support of the price at several points. At the moment, the price is fluctuating above S1 and we expect a little rise to R1 and then by considering our short position, a decline will be waiting for it to S1. Also it is probable for the price to rise more if it fixes over R1 and above $60 amount. Please remember to activate your stop-loss in order to have less risky trades.
Warning: This is just a suggestion and we do not guarantee profits. We advise you to analyze the chart before opening any positions.
Wish you luck

EGLDUSDT | BREAKOUT SET UPEGLD is attempting Breakout on daily time frame. Price action has formed a triangular pattern however the zone is tougher and bulls will have to make the strong effort to make the breakout possible. Stop loss is always the key.


EGOLD buy setupafter being bearish for a while Egold has finally broken out of the desceding trendline and has also broken above the upward trendline and has come to retest it leaving a bullish hammer as a confirmation to more upside

EGLD | ew | price targetsthe same for elrond also ! last pump before dump , a clean WXY patern wich is corrective ! after is finished egld will dump and take the previous low along with btc ! targets is 66 for a flat , and we will have 1 to 1 will be 80 $ , after that i expect the last dump along with btc , full road and full analyse on long term for btc is on my social channels

EGLD long$EGLD is bouncing off the support level. Bullish movement to resistance level at 57$ is possible.

EGLD SELLi see further downside on egold for a further drop, following this chanel we can see price repespecting the diagonal support and resistance

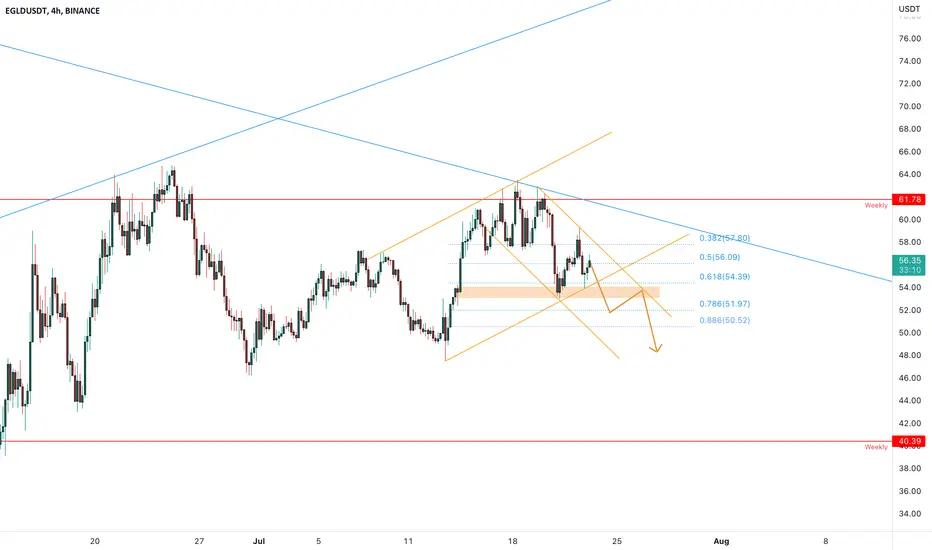
EGLDUSDT is testing the 0.618 Fibonacci levelThe price is creating a double top on the weekly resistance at 64$ and the market got a rejection from it. Athe the moment the price is trying to hold the 0.618 Fibonacci level as support.
How to approach it?
IF the price is going to lose the local support, According to Plancton's strategy , we can set a nice order
–––––
Keep in mind.
🟣 Purple structure -> Monthly structure.
🔴 Red structure -> Weekly structure.
🔵 Blue structure -> Daily structure.
🟡 Yellow structure -> 4h structure.
–––––
Follow the Shrimp 🦐