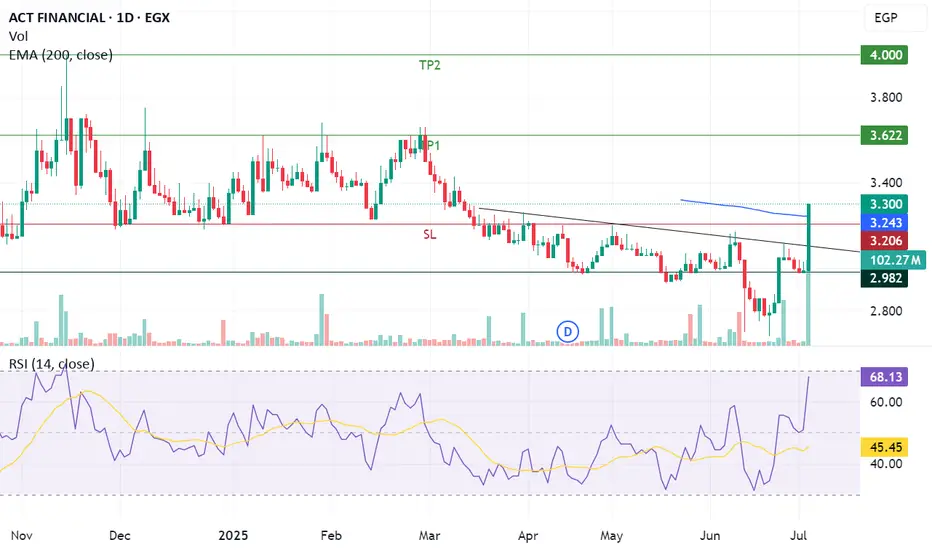
Significant resistance breakthroughACTF just breakthrough a horizontal resistance level and a declining resistance line which supports an uptrend targeting 3.6 as a 1st target and 4 as a 2nd target.
About ACT FINANCIAL
Sector
Industry
CEO
Bassem Azab
Website
Headquarters
New Cairo
Founded
2015
ISIN
EGS7D5P1C019
FIGI
BBG01MQ8L7L2
Act Financial engages in investment banking services. It provides diverse forms of equity investments, strategically engaging in buyouts, leveraged acquisitions, and a spectrum of liquid and illiquid investment opportunities. The company was founded by Bassem Azab, Mostafa Abdel Aziz and Karim Nehma on April 22, 2015 and is headquartered in New Cairo, Egypt.
Related stocks
ACT FINANCIAL (EGX) – Sideways Trade with Breakout PotentialHere’s a TradingView idea for your sideways trade setup with a potential breakout:
---
**ACT FINANCIAL (EGX) – Sideways Trade with Breakout Potential**
📉 **Technical Analysis:**
The stock is currently trading within a sideways range, showing strong support and resistance levels. The price i

Act Financial Egypt has a potential to 4.22Daily chart, the stock EGX:ACTF formed a chart pattern (triangle), and the price penetrated the resistance line R.
The target is 4.22 passing through resistance levels 3.60, 3.75 and 4.00
A re-test to line R / pivot level down to 3.40 - 3.37 may happen before the bullish movement.
So, watch c

#ACTF Egyptian stockanther gartly pattern appeared
so according to below chart (time frame 1 hour)
entry level 3.37
target 1 = 3.55
target 2 = 3.65
stop loss =3.30 (1 hour close)
note : this data according to time frame 1 hour
Its not an advice for investing only my vision according to the data on chart
Please consu

Actf important levels Hello dear traders
Actf just got released today.
Important levels to watch 3.764 then 4.07
And one cycle upward target is 5.45.
Strong support 3.45 ..3.15
Close Below 3.15 is a stop.
Chart has the important levels based on gann methods.

See all ideas
Summarizing what the indicators are suggesting.
Oscillators
Neutral
SellBuy
Strong sellStrong buy
Strong sellSellNeutralBuyStrong buy
Oscillators
Neutral
SellBuy
Strong sellStrong buy
Strong sellSellNeutralBuyStrong buy
Summary
Neutral
SellBuy
Strong sellStrong buy
Strong sellSellNeutralBuyStrong buy
Summary
Neutral
SellBuy
Strong sellStrong buy
Strong sellSellNeutralBuyStrong buy
Summary
Neutral
SellBuy
Strong sellStrong buy
Strong sellSellNeutralBuyStrong buy
Moving Averages
Neutral
SellBuy
Strong sellStrong buy
Strong sellSellNeutralBuyStrong buy
Moving Averages
Neutral
SellBuy
Strong sellStrong buy
Strong sellSellNeutralBuyStrong buy
Displays a symbol's price movements over previous years to identify recurring trends.
Frequently Asked Questions
The current price of ACTF is 3.040 EGP — it hasn't changed in the past 24 hours. Watch ACT FINANCIAL stock price performance more closely on the chart.
Depending on the exchange, the stock ticker may vary. For instance, on EGX exchange ACT FINANCIAL stocks are traded under the ticker ACTF.
ACTF stock has fallen by −5.59% compared to the previous week, the month change is a 8.96% rise, over the last year ACT FINANCIAL has showed a 4.83% increase.
ACTF reached its all-time high on Nov 14, 2024 with the price of 4.000 EGP, and its all-time low was 2.680 EGP and was reached on Jun 22, 2025. View more price dynamics on ACTF chart.
See other stocks reaching their highest and lowest prices.
See other stocks reaching their highest and lowest prices.
ACTF stock is 0.99% volatile and has beta coefficient of 1.22. Track ACT FINANCIAL stock price on the chart and check out the list of the most volatile stocks — is ACT FINANCIAL there?
Yes, you can track ACT FINANCIAL financials in yearly and quarterly reports right on TradingView.
Yes, ACTF dividends are paid annually. The last dividend per share was 0.17 EGP. As of today, Dividend Yield (TTM)% is 5.61%. Tracking ACT FINANCIAL dividends might help you take more informed decisions.
Like other stocks, ACTF shares are traded on stock exchanges, e.g. Nasdaq, Nyse, Euronext, and the easiest way to buy them is through an online stock broker. To do this, you need to open an account and follow a broker's procedures, then start trading. You can trade ACT FINANCIAL stock right from TradingView charts — choose your broker and connect to your account.
Investing in stocks requires a comprehensive research: you should carefully study all the available data, e.g. company's financials, related news, and its technical analysis. So ACT FINANCIAL technincal analysis shows the sell today, and its 1 week rating is sell. Since market conditions are prone to changes, it's worth looking a bit further into the future — according to the 1 month rating ACT FINANCIAL stock shows the neutral signal. See more of ACT FINANCIAL technicals for a more comprehensive analysis.
If you're still not sure, try looking for inspiration in our curated watchlists.
If you're still not sure, try looking for inspiration in our curated watchlists.