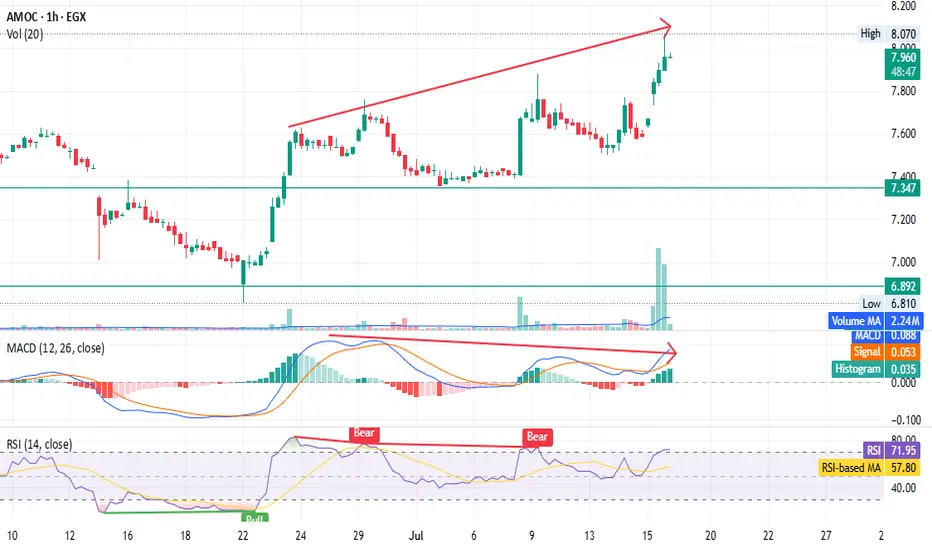
AMOC - Beware of the bear trap - only for shareholders EGX:AMOC timeframe: 1 hour
Prices continue to rise, forming a higher top than the previous one,
but MACD shows a negative divergence.
RSI indicates bearish dominance despite the price increase.
High volume with a gap, unsupported by other indicators, suggests possible distribution.
Stop lo
Next report date
—
Report period
—
EPS estimate
—
Revenue estimate
—
0.973 EGP
1.52 B EGP
33.77 B EGP
555.00 M
About ALEXANDRIA MINERAL OILS COMPANY
Sector
Industry
CEO
Amr Ahmed Lofty
Website
Headquarters
Alexandria
Founded
1997
ISIN
EGS380P1C010
FIGI
BBG000F15J58
Alexandria Mineral Oils Co. engages in the production of oil and paraffin wax. Its products include fully refined hydrotreated and unhydrotreated paraffin waxes, transformer, base, and fuel oils, and automatic transmission fluids. The company was founded on May 6, 1997 and is headquartered in Alexandria, Egypt.
Related stocks
Breakthrough significant downtrend resistance line - EMA200 AMOC has successfully penetrated significant downtrend resistance line and EMA200 supported by volume exceeding average 30 days vol, targeting the bellow level:
- Potential buy range: 7.8 - 7.9
- TP1: 8.7
- TP2: 9.8
- SL: below 7.5

AMOC Long If the price holds the 0.618, then we are seeing a new ath. Highly good play in here.
Just be aware that there is a resistance @ 11.7 to 12.7. Take some profits at this level and move your SL to breakeven.

AMOC long update The stock was in a strong downtrend, but it seems to be reversing to the upside.
On the bright side, or the bullish side, the price has started making higher highs and higher lows, which could be a good sign if we consider this recent downtrend a pullback within a larger uptrend.
On the bearish si

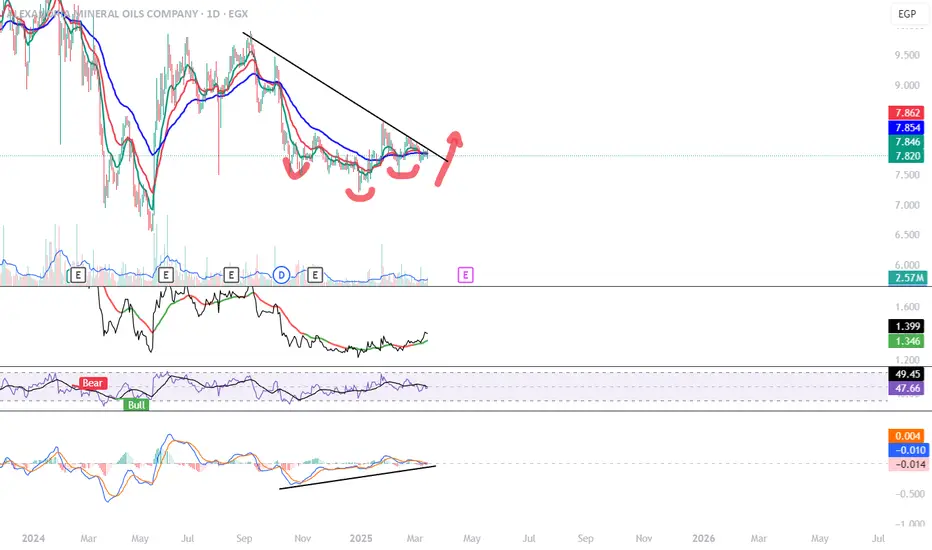
AMOC (Alexandria Mineral Oils Company) – Bullish Breakout Ahead?
**📈 AMOC (Alexandria Mineral Oils Company) – Bullish Breakout Ahead? 🚀**
🔎 **Technical Analysis (1D Chart):**
AMOC has been trading in a long-term downtrend but is now showing signs of a potential reversal. The price action has formed what appears to be an **inverse head and shoulders pattern
#AMOC Egyptian stock #EGX30 According to below chart there is gartly pattern at time frame 1 hour
entry level from 7.71 to 7.77
stop loss 7.70 ( closing 1 hour )
target 1 = 7.85
target 2 = 8.00
may the prices go down to 7.65 and 7.59 then going up to achieve the below targets that's according to anther pattern but on time fr

There's no guarantee your mom won't get that far. Are There ?I had the idea of what it is to ensure that the price does not fall to the level of daily and weekly imbalance of the price shown in the chart. Just an idea
It seems logical and likely not now, but possible in the near future.
It is honest to offer this idea to you for caution and precaution.
Despi

AMOC Egypt has a good trading opportunity to 8.9AMOC Egypt has a good trDaily chart
The stock EGX:AMOC is trading in a channel between lines R and S, so the opportunity to buy near support S and sell near resistance line R (at around 8.9)
Technical indicators RSI and MACD are supporting the bullish view.
Closing above 9.0 for 3 days, the ta

AMOC Egypt has a good trading opportunity to 8.9Daily chart
The stock EGX:AMOC is trading in a channel between lines R and S, so the opportunity to buy near support S and sell near resistance line R (at around 8.9)
Technical indicators RSI and MACD are supporting the bullish view.
Closing above 9.0 for 3 days, the target will be 10.5
Closing

Comprehensive Technical Analysis and Outlook for AMOC Stock
The AMOC stock chart presents a detailed technical analysis using various indicators and overlays. At the top, the Volume Price Trend (VPT) indicator highlights cumulative volume adjusted for price changes, indicating significant buying and selling pressures through its peaks and troughs. The Effo

See all ideas
Summarizing what the indicators are suggesting.
Neutral
SellBuy
Strong sellStrong buy
Strong sellSellNeutralBuyStrong buy
Neutral
SellBuy
Strong sellStrong buy
Strong sellSellNeutralBuyStrong buy
Neutral
SellBuy
Strong sellStrong buy
Strong sellSellNeutralBuyStrong buy
An aggregate view of professional's ratings.
Neutral
SellBuy
Strong sellStrong buy
Strong sellSellNeutralBuyStrong buy
Neutral
SellBuy
Strong sellStrong buy
Strong sellSellNeutralBuyStrong buy
Neutral
SellBuy
Strong sellStrong buy
Strong sellSellNeutralBuyStrong buy
Displays a symbol's price movements over previous years to identify recurring trends.
Frequently Asked Questions
The current price of AMOC is 7.470 EGP — it has decreased by −1.31% in the past 24 hours. Watch ALEXANDRIA MINERAL OILS COMPANY stock price performance more closely on the chart.
Depending on the exchange, the stock ticker may vary. For instance, on EGX exchange ALEXANDRIA MINERAL OILS COMPANY stocks are traded under the ticker AMOC.
AMOC stock has fallen by −2.58% compared to the previous week, the last month showed zero change in price, over the last year ALEXANDRIA MINERAL OILS COMPANY has showed a −16.16% decrease.
We've gathered analysts' opinions on ALEXANDRIA MINERAL OILS COMPANY future price: according to them, AMOC price has a max estimate of 10.00 EGP and a min estimate of 10.00 EGP. Watch AMOC chart and read a more detailed ALEXANDRIA MINERAL OILS COMPANY stock forecast: see what analysts think of ALEXANDRIA MINERAL OILS COMPANY and suggest that you do with its stocks.
AMOC reached its all-time high on May 20, 2018 with the price of 12.750 EGP, and its all-time low was 1.410 EGP and was reached on Mar 19, 2020. View more price dynamics on AMOC chart.
See other stocks reaching their highest and lowest prices.
See other stocks reaching their highest and lowest prices.
AMOC stock is 2.02% volatile and has beta coefficient of 1.12. Track ALEXANDRIA MINERAL OILS COMPANY stock price on the chart and check out the list of the most volatile stocks — is ALEXANDRIA MINERAL OILS COMPANY there?
Today ALEXANDRIA MINERAL OILS COMPANY has the market capitalization of 9.75 B, it has increased by 3.55% over the last week.
Yes, you can track ALEXANDRIA MINERAL OILS COMPANY financials in yearly and quarterly reports right on TradingView.
ALEXANDRIA MINERAL OILS COMPANY is going to release the next earnings report on Aug 18, 2025. Keep track of upcoming events with our Earnings Calendar.
AMOC net income for the last quarter is 130.71 M EGP, while the quarter before that showed 413.20 M EGP of net income which accounts for −68.37% change. Track more ALEXANDRIA MINERAL OILS COMPANY financial stats to get the full picture.
ALEXANDRIA MINERAL OILS COMPANY dividend yield was 7.73% in 2024, and payout ratio reached 63.73%. The year before the numbers were 8.00% and 70.51% correspondingly. See high-dividend stocks and find more opportunities for your portfolio.
EBITDA measures a company's operating performance, its growth signifies an improvement in the efficiency of a company. ALEXANDRIA MINERAL OILS COMPANY EBITDA is 1.41 B EGP, and current EBITDA margin is 4.59%. See more stats in ALEXANDRIA MINERAL OILS COMPANY financial statements.
Like other stocks, AMOC shares are traded on stock exchanges, e.g. Nasdaq, Nyse, Euronext, and the easiest way to buy them is through an online stock broker. To do this, you need to open an account and follow a broker's procedures, then start trading. You can trade ALEXANDRIA MINERAL OILS COMPANY stock right from TradingView charts — choose your broker and connect to your account.
Investing in stocks requires a comprehensive research: you should carefully study all the available data, e.g. company's financials, related news, and its technical analysis. So ALEXANDRIA MINERAL OILS COMPANY technincal analysis shows the strong sell today, and its 1 week rating is sell. Since market conditions are prone to changes, it's worth looking a bit further into the future — according to the 1 month rating ALEXANDRIA MINERAL OILS COMPANY stock shows the neutral signal. See more of ALEXANDRIA MINERAL OILS COMPANY technicals for a more comprehensive analysis.
If you're still not sure, try looking for inspiration in our curated watchlists.
If you're still not sure, try looking for inspiration in our curated watchlists.