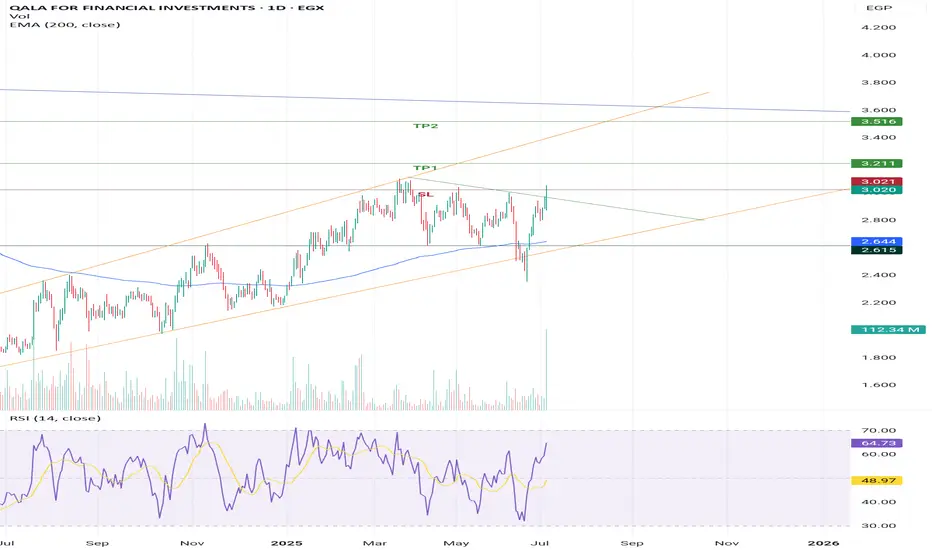
Upside wedge + breakthrough short term downtrend resistance linCCAP has been moving in an upside wedge since May 2024 and faced a downtrend resistance line which it succeeded to breakthrough today with a volume exceeding the past 12 month.
- Potential buy range: 2.97:3.05
- TP1: 3.2
- TP2: 3.5
- SL: 2.97 "confirmation required"
−3.30 B EGP
148.87 B EGP
1.22 B
About QALA FOR FINANCIAL INVESTMENTS
Sector
Industry
CEO
Hisham Hussein El-Khazindar
Website
Headquarters
Cairo
Founded
2004
ISIN
EGS73541C012
FIGI
BBG000BSHCW5
Qala For Financial Investments engages in investing to energy, cement, foods, transportation and logistics, and mining industries. It specializes in growth capital, turnarounds, leveraged buyouts, consolidations, industry roll-ups, green fields, and distressed investments. The company was founded by Ahmed Heikal and Hisham El-Khazindar on April 13, 2004 and is headquartered in Cairo, Egypt.
Related stocks
#ccapstrong chart its up from strong demand yellow zone it forms large bullish harmonic butterfly pattern
its target 1.74 EGP
ADD on it forms large inverted head and shoulders pattern its target 1.93 EGP

bullish trade setup for **QALA
### **Key Observations:**
1. **Breakout from Resistance**
- The stock has recently **broken above a key resistance level** around **2.88 - 3.08 EGP**, indicating bullish momentum.
- A successful retest of this zone could confirm it as a **new support level**.
2. **Volume Profile Analysis*

#CCAP Egyptian stock#CCAP time frame 1 DAY
Created a bearish Gartley pattern
Sell point at 2.57
Stop loss / reentry 2.63 ( estimated loss -2.15% )
First target at 2.44 ( estimated profit 5% )
Second target 2.32 up to 2.24 ( estimated profit up to 13% )
and may prices still going down to around 2.00 .
the profit in thi

CCAP
analysis performed using the following strategies and indicators:
Ichimoku Kinko Hyo
Law of diminishing returns
Volume price trend
Relative Strength Index (RSI)
Average True Range (ATR)
Linear Regression

CCAP: negative trendThe CCAP analysis indicates a prevailing negative trend, with the stock price significantly below its moving averages and clear bearish signals from the MACD and RSI indices. Volumes are also notably down, reinforcing a lack of buying interest. However, there is a potential support zone around the 2

Advanced Trading Strategies Using Multiple IndicatorsTechnical Analysis Report: Advanced Trading Strategies Using Multiple Indicators
Introduction:
In this educational video, a comprehensive approach to technical analysis is presented, focusing on the identification of trend reversals and entry points in the market. The strategy incorporates a divers

The Dramatic Showdown: CCAP Bulls Unleashed! The Dramatic Showdown: CCAP Bulls Unleashed!
Will the Bears Survive the Onslaught?
Picture this: CCAP, the star of our daily drama, still dances below the menacing red line. Enter Chikou span, the hero of our story, soaring through the sky like a superhero ready to save the day with a 15% uptr

Captain Contrairian: Connoisseur of Cryptic Market MovesIs CCAP the Sultan of Short-Term Swagger: the Master of Market Mysteries?
The recent trading activity of CCAP, including its importance of the 5EGP level in analyzing the impact of the debt swap rumors that led to a stock price crash, is critically relevant. Notably, CCAP trading was halted for the

CCAP has a potential to test 2.30 and 1.49Weekly chart, the stock is trading in a channel that has the support line (S2) since June 2022.
Another minor support line is S1 and a probable one S3
I think it will go to 2.30 then sideways before rebounding and touching the resistance line R in 7 - 8 months.
Below 2.30 the next support (line S3

See all ideas
Summarizing what the indicators are suggesting.
Neutral
SellBuy
Strong sellStrong buy
Strong sellSellNeutralBuyStrong buy
Neutral
SellBuy
Strong sellStrong buy
Strong sellSellNeutralBuyStrong buy
Neutral
SellBuy
Strong sellStrong buy
Strong sellSellNeutralBuyStrong buy
An aggregate view of professional's ratings.
Neutral
SellBuy
Strong sellStrong buy
Strong sellSellNeutralBuyStrong buy
Neutral
SellBuy
Strong sellStrong buy
Strong sellSellNeutralBuyStrong buy
Neutral
SellBuy
Strong sellStrong buy
Strong sellSellNeutralBuyStrong buy
Displays a symbol's price movements over previous years to identify recurring trends.
Frequently Asked Questions
The current price of CCAP is 3.060 EGP — it has increased by 1.32% in the past 24 hours. Watch QALA FOR FINANCIAL INVESTMENTS stock price performance more closely on the chart.
Depending on the exchange, the stock ticker may vary. For instance, on EGX exchange QALA FOR FINANCIAL INVESTMENTS stocks are traded under the ticker CCAP.
CCAP stock has fallen by −1.29% compared to the previous week, the month change is a 6.99% rise, over the last year QALA FOR FINANCIAL INVESTMENTS has showed a 36.61% increase.
We've gathered analysts' opinions on QALA FOR FINANCIAL INVESTMENTS future price: according to them, CCAP price has a max estimate of 3.50 EGP and a min estimate of 3.40 EGP. Watch CCAP chart and read a more detailed QALA FOR FINANCIAL INVESTMENTS stock forecast: see what analysts think of QALA FOR FINANCIAL INVESTMENTS and suggest that you do with its stocks.
CCAP reached its all-time high on Dec 6, 2009 with the price of 13.900 EGP, and its all-time low was 0.630 EGP and was reached on Oct 24, 2016. View more price dynamics on CCAP chart.
See other stocks reaching their highest and lowest prices.
See other stocks reaching their highest and lowest prices.
CCAP stock is 3.68% volatile and has beta coefficient of 1.48. Track QALA FOR FINANCIAL INVESTMENTS stock price on the chart and check out the list of the most volatile stocks — is QALA FOR FINANCIAL INVESTMENTS there?
Today QALA FOR FINANCIAL INVESTMENTS has the market capitalization of 5.57 B, it has decreased by −2.76% over the last week.
Yes, you can track QALA FOR FINANCIAL INVESTMENTS financials in yearly and quarterly reports right on TradingView.
No, CCAP doesn't pay any dividends to its shareholders. But don't worry, we've prepared a list of high-dividend stocks for you.
Like other stocks, CCAP shares are traded on stock exchanges, e.g. Nasdaq, Nyse, Euronext, and the easiest way to buy them is through an online stock broker. To do this, you need to open an account and follow a broker's procedures, then start trading. You can trade QALA FOR FINANCIAL INVESTMENTS stock right from TradingView charts — choose your broker and connect to your account.
Investing in stocks requires a comprehensive research: you should carefully study all the available data, e.g. company's financials, related news, and its technical analysis. So QALA FOR FINANCIAL INVESTMENTS technincal analysis shows the buy rating today, and its 1 week rating is buy. Since market conditions are prone to changes, it's worth looking a bit further into the future — according to the 1 month rating QALA FOR FINANCIAL INVESTMENTS stock shows the strong buy signal. See more of QALA FOR FINANCIAL INVESTMENTS technicals for a more comprehensive analysis.
If you're still not sure, try looking for inspiration in our curated watchlists.
If you're still not sure, try looking for inspiration in our curated watchlists.