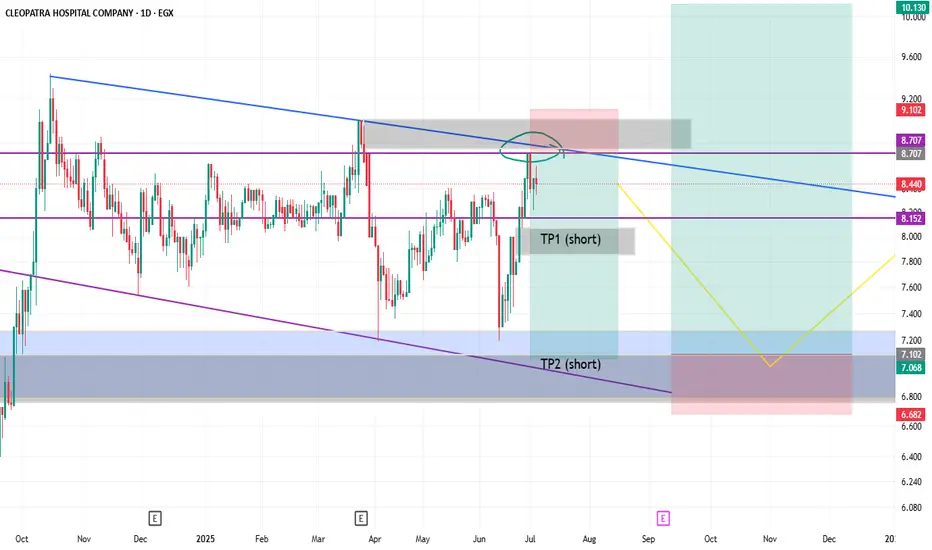
CLHO Short (midterm)Well, This is a countertrend trade, so be cautious.
1- uptrend
2- Chart pattern (bullflag)
3- Price is within downward channel that could translates to short opportunity, but in the long term the price will hit higher.
4- Also since its an uptrend so its also possible that the price will close above the blue line and continue higher from there, but since lately the price action is bearish so i would lean bearish until 7.12 EGP, then bullish from there.
5- I hope that the price wicks in the gray area above the blue trendline and from then go to the 1h tf, check if the price action turns bearish, and we can enter from there.
Check the news, also the economical situation in Egypt has been good lately and expected to do better in the coming months, so short positions should be monitored.
DYOR
CLHO trade ideas
A bullish crossover would add confirmation.1. Chart Pattern Analysis:**
- The chart shows a **symmetrical triangle** formation, which is a **neutral pattern** that can break in either direction.
- The price is near the **apex of the triangle**, meaning a breakout is imminent.
- **Bullish Breakout Confirmation:** The latest candle appears to be attempting a breakout above the upper trendline.
#### **2. Support & Resistance Levels:**
- **Resistance Levels:**
- **8.41 EGP (current price level)**
- **8.51 - 8.60 EGP** (previous consolidation area)
- **9.05 EGP** (potential target after breakout)
- **Support Levels:**
- **8.22 EGP** (nearby support)
- **8.11 - 8.05 EGP** (critical support)
- If the price falls below **8.00 EGP**, the pattern may fail and lead to a downtrend.
#### **3. Volume & Momentum Indicators:**
- **Volume (2.69M)**:
- A significant increase in volume is needed to confirm a breakout.
- If volume remains low, the price might retest support.
- **RSI (Relative Strength Index):**
- RSI is trending upwards but not yet in the overbought zone.
- If it crosses above **70**, it would confirm strong bullish momentum.
- **MACD (Moving Average Convergence Divergence):**
- The MACD is **slightly positive**, signalling potential bullish momentum.
- A bullish crossover would add confirmation.
#### **4. Potential Future Scenarios:**
- **Bullish Case (Breakout Above 8.51 EGP)**
- If the price breaks and sustains above **8.51 EGP**, it may target **9.05 EGP** and beyond.
- Increased volume would strengthen the breakout signal.
- **Bearish Case (Failure at Resistance)**
- If the price fails to break and closes below **8.00 EGP**, it could drop towards **7.80-7.50 EGP**.
- A breakdown below **8.00 EGP** invalidates the bullish case.
### **Conclusion & Trading Plan:**
- **Watch for a breakout confirmation above 8.51 EGP** with high volume.
- **Stop-loss below 8.00 EGP** to protect against a false breakout.
- **Upside Target:** 9.05 EGP and higher if momentum continues.
🚀

CLHO break a harmonic pattern.A breach of the established harmonic pattern by CLHO will be confirmed upon surpassing Fibonacci level 8.3. Subsequently, a clear trajectory towards the preceding high at level 9 is anticipated. A retest of Fibonacci level 8.3 may then occur prior to a potential breach of the harmonic pattern target. A bullish trend is expected in the short term. Should level 9 be exceeded, a bullish trend is projected for the medium term.

CLHO H&S Chart PatternCLHO created a head and shoulder Chart pattern, the target is the main volume resistance of the stock 5.4 range.

CLHO to target 9.5 after crossing 6Weekly chart, CLHO is preparing to form a chart pattern and its target is 9.5 : After crossing the resistance line (blue) at 5.7 and confirming number 6.0
Stop loss at 5
Note: It is an investment not a daily trading.

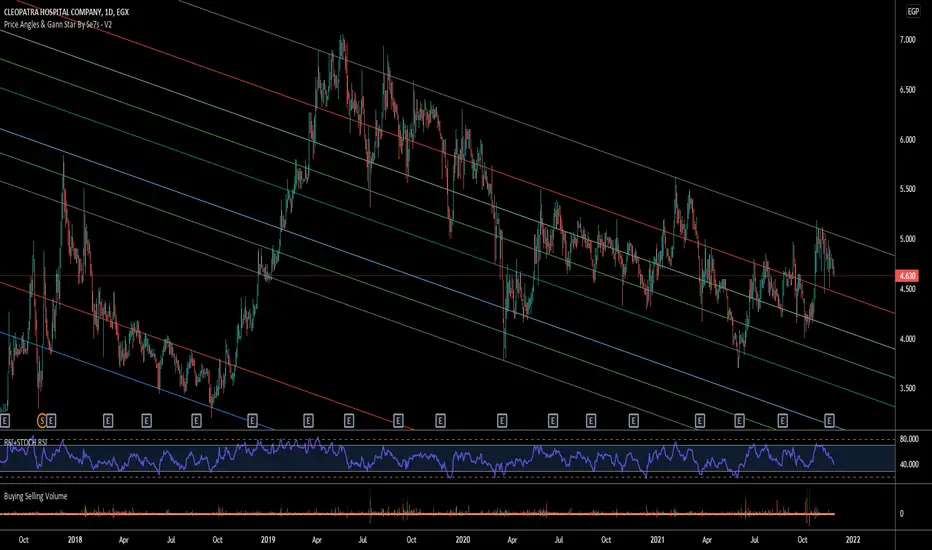
Music box for CLHOso Covid 19? O Micron ?
well... have an eye on that. but dont focus on the news. but focus on the FIB Channel levels.
Simple FIb CHannel for CLHO.
Good luck
CLHO Harmonic and IchimokuCLHO is forming Bat and Crab Harmonic pattern with positive Ichimoku signal.
