EDBMthe stock is accumulating and after breaking and close above 1.16 we are going to reach 2 L.E. in shaa allah
EDBM trade ideas

EDBM The Egyptian Company for Construction Development
📉 **Market Overview:**
The Egyptian Company for Construction Development (EGX) has recently experienced a sharp decline, breaking through key Fibonacci levels. The stock is currently trading at **0.645 EGP**, showing a slight rebound after a significant sell-off.
🔍 **Technical Analysis:**
- The price has **broken below the 0.618 Fibonacci retracement level (0.653 EGP)**, a crucial support zone.
- A strong rejection at the **0.382 Fibonacci level (0.716 EGP)** earlier indicated weakness in the uptrend.
- The next major support lies around **0.608 EGP (0.786 Fibonacci level)**, with an extended potential drop to **0.553 EGP** if sellers remain in control.
- Resistance is now formed at **0.685 EGP (0.5 Fibonacci level)** and **0.716 EGP**, which must be reclaimed for any bullish recovery.
📊 **Potential Scenarios:**
🔴 **Bearish Case:** If the price fails to hold above **0.613 EGP**, we could see further downside pressure towards **0.553 EGP**.
🟢 **Bullish Case:** A bounce above **0.653 EGP** could trigger a recovery towards **0.685 EGP** and possibly **0.716 EGP** if buyers regain momentum.
⚠️ **Key Takeaway:**
Traders should watch for price action near the 0.608 - 0.613 EGP range. A confirmed bounce could signal a recovery, while further breakdowns may lead to extended losses.
📌 **What’s your outlook on this stock? Drop your thoughts in the comments! 🚀🔥**

EDBMtrend up
falling wedge on 1H frame
bulish Gartely on Daliy frame entry point 0.288 EGP stop loss 0.26 EGP
target 0.338 EGP then 0.385 EGP then .57 EGP

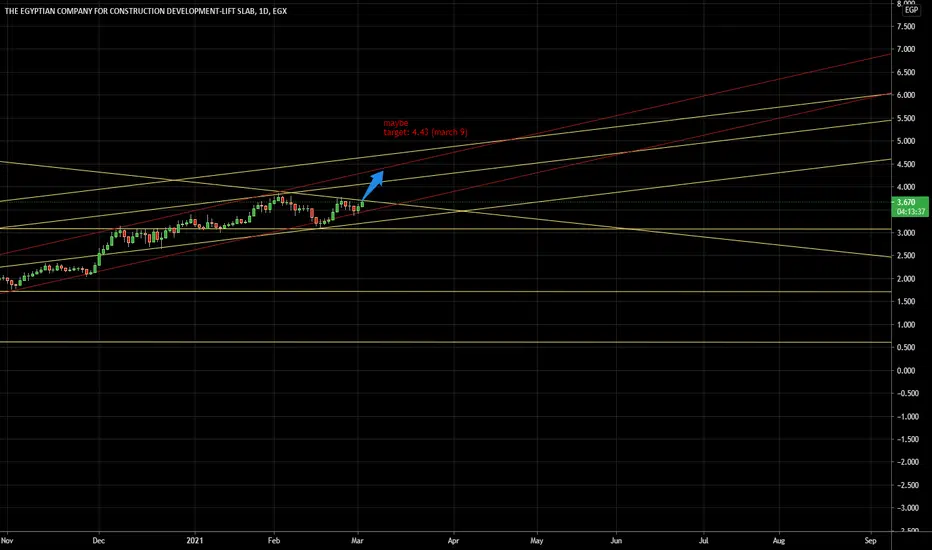
Lift Slab Egypt has a strong potential to hit resistance at 0.44Weekly chart, the stock EGX:EDBM is trading in a rising channel, and the technical indicators MACD and RSI are showing the strong potential to target the resistance line R at around 0.44
(Used Heikin Ashi candlesticks to remove noise)
Stop loss below 0.295 should be considered.

In Demand ZoneI think it will break the demand zone, the price is lower than the book value and RSI divergence


NEXT MARKET MOVE UP TO 2023NEXT MARKET MOVE UP TO 2023
At the bold black line, a major area,
At the orange line, a sub area
WE CAN UPDATE AFTER BROKEN

Lift Slab analysisBreaking 0.306 L.E most probable will change the behavior to uptrend
Other Resistances 0.32 , 0.35, 0.4 ,0.45, 0.56


going for double top?Possible support and resistance . GL. horizontal lines are Support/Resistance . Vertical lines are time pivots