EGX 30🔍 Technical Analysis Summary:
📍 Sell Entry Point:
Price: 33,196.164
This level represents a potential reversal zone after testing a strong resistance area. Signs of buyer exhaustion suggest a possible downward move.
📍 Stop Loss (SL):
Level: 33,707.466
Positioned above a key resistance zone (hig
About EGX 30 Index
The EGX 30 Index, one of the most prominent benchmarks of the Egyptian market, tracks the performance of the 30 most active and liquid companies. It reflects the overall movement of the market and provides insights into investor sentiment.
Related indices

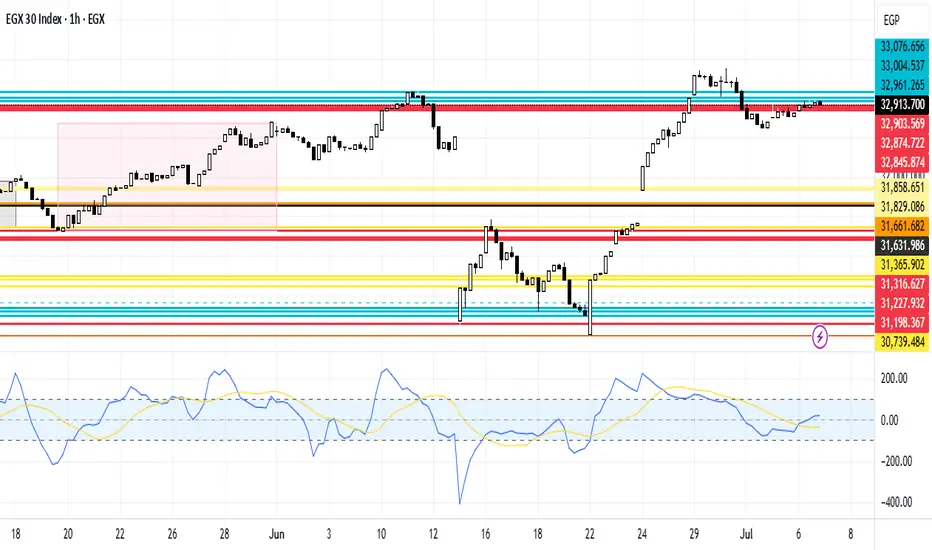
EGX30 Neutrality ZoneEGX30 stock is currently in a neutral region. In case of deceasing, it's expected to break the support line 32,903.569, 32,74.722 and 32,845.874. In case of increasing, it's expected to breach the resistance line 32,961.265, 33,004.537 then 33,076.656
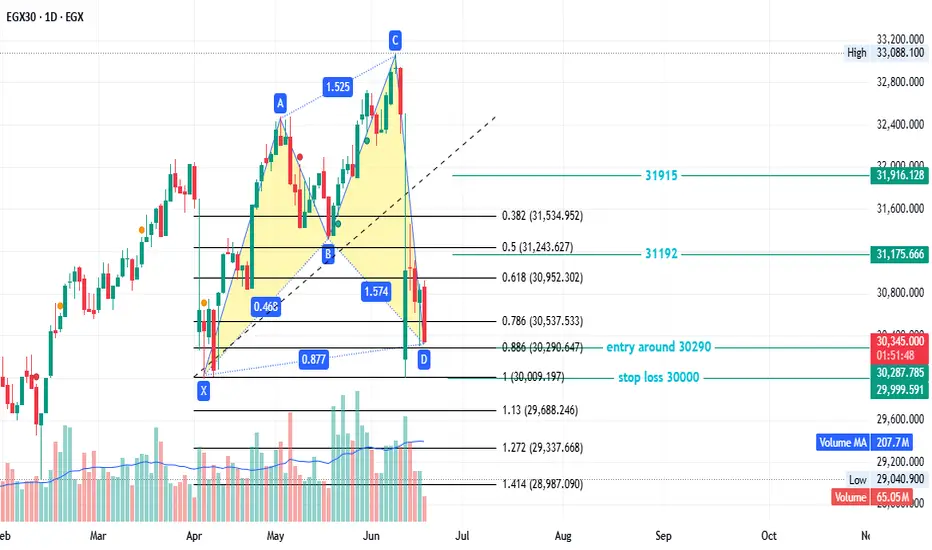
EGX30 - good newsEGX30 created a bullish pattern
entry around 30290
stop loss 30000
first target 31192
secund target 31915
This is not investment advice—only my analysis based on chart data. Consult your account manager before investing. Good luck!
EGX30 in a Lower RegionEGX30 stock is currently in a decreasing region. It's expected to rebound as historically on the short term it didn't brak the support line 30,238.217. Accordingly, it's expected to rebound to reach the resistance line 30,604.998 to reach then 2nd at 30,690.58 then the third at 30,739.484

Rebound of EGX30EGX30 stock is currently in an increasing region. In case of falling, it's expected to break the support line 32,892.565 to reach then 2nd at 32,568.193 then the third at 32,543.242. In case of rising, it's expected to rebound at the resistance line of 32,934.151, to reach the 2nd at 32,875.931 then

EGX30 Current Region AnalysisEGX30 stock is currently in a neutral region. In case of falling, it's expected to break the support line 32,498.905 to reach then 2nd at 32,408.426 then the third at 32,376.503. In case of rising, it's expected to breach the resistance line 32,546.761, to reach then 2nd at 32,621.248 then the 3rd a

EGX 30 bird view:* White line (trend): Breakout = Long.
* Purple line (resistance): Breakout & confirmation = Long, target 34,450 resistance.
* Orange line (annual resistance): Breakout = Short.
* Blue line (cup & handle): Breakout 18 Feb, confirmed 5 April.

EGX30 Increases by 0.62%EGX30 stock has jumped to an upper region, and it's apparent that this has been a gradual upward trend due to a mutual connection between positive fundamental news and the technical candlestick analysis. It has already breached the resistance line of 32,621.248 and reached the maximum at 32,695.736

EGX30 Movement AnalysisEGX30 stock is currently in a higher region than before. Unfortunately it rebounded to the support line 31,907.926. In the case of continuing downward it's expected to reach the support line 31,858.651 then break the support line 31,829.086. In case of taking an upward trend, it is expected to breac
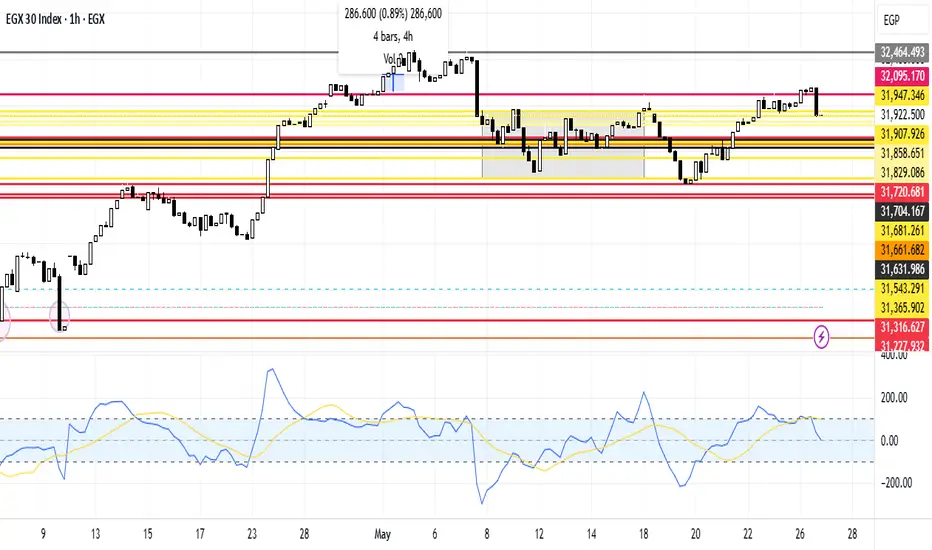
EGX30 in a Higher RegionEGX30 stock is currently in a higher region than before. In the case of taking an upward trend, it is expected to breach the resistance line at 32,026.185 and then reach the resistance line at 32,055.750. And reach the third resistance line at 32,095.170 points. In case of falling, it's expected to

See all ideas
Summarizing what the indicators are suggesting.
Oscillators
Neutral
SellBuy
Strong sellStrong buy
Strong sellSellNeutralBuyStrong buy
Oscillators
Neutral
SellBuy
Strong sellStrong buy
Strong sellSellNeutralBuyStrong buy
Summary
Neutral
SellBuy
Strong sellStrong buy
Strong sellSellNeutralBuyStrong buy
Summary
Neutral
SellBuy
Strong sellStrong buy
Strong sellSellNeutralBuyStrong buy
Summary
Neutral
SellBuy
Strong sellStrong buy
Strong sellSellNeutralBuyStrong buy
Moving Averages
Neutral
SellBuy
Strong sellStrong buy
Strong sellSellNeutralBuyStrong buy
Moving Averages
Neutral
SellBuy
Strong sellStrong buy
Strong sellSellNeutralBuyStrong buy
Displays a symbol's price movements over previous years to identify recurring trends.
Frequently Asked Questions
The current value of EGX 30 Index is 34,076.200 EGP — it has fallen by 0.00% in the past 24 hours. Track the index more closely on the EGX 30 Index chart.
EGX 30 Index reached its highest quote on Mar 11, 2024 — 34,501.898 EGP. See more data on the EGX 30 Index chart.
The lowest ever quote of EGX 30 Index is 445.530 EGP. It was reached on Jan 28, 2002. See more data on the EGX 30 Index chart.
EGX 30 Index value has increased by 1.38% in the past week, since last month it has shown a 5.99% increase, and over the year it's increased by 17.12%. Keep track of all changes on the EGX 30 Index chart.
The champion of EGX 30 Index is EGX:ISPH — it's gained 245.79% over the year.
The weakest component of EGX 30 Index is EGX:EKHOA — it's lost −26.47% over the year.
EGX 30 Index is just a number that lets you track performance of the instruments comprising the index, so you can't invest in it directly. But you can buy EGX 30 Index futures or funds or invest in its components.
The EGX 30 Index is comprised of 31 instruments including EGX:COMI, EGX:TMGH, EGX:EAST and others. See the full list of EGX 30 Index components to find more opportunities.