EGX 30🔍 Technical Analysis Summary:
📍 Sell Entry Point:
Price: 33,196.164
This level represents a potential reversal zone after testing a strong resistance area. Signs of buyer exhaustion suggest a possible downward move.
📍 Stop Loss (SL):
Level: 33,707.466
Positioned above a key resistance zone (highlighted in red). If price breaks above this level, the bearish setup would be invalidated.
📍 Target Levels (Take Profit):
Target 1 (T1): 31,693.736
A well-established support level tested multiple times. A likely bounce zone.
Target 2 (T2): 31,300.428
A deeper support area. This level offers a more extended profit target if bearish momentum continues.
📈 Price Action & Trend Insight:
The recent movement shows a temporary bullish correction, but momentum is fading near the resistance zone between 33,472 – 33,707.
A possible double-top pattern has formed, indicating weakness in buying pressure.
If the price breaks below 32,900, this could trigger accelerated selling toward T1 and T2.
📌 Additional Notes:
✅ Risk-to-Reward Ratio:
Risk (SL to Entry): ~510 points
Reward to T1: ~1,500 points
Reward to T2: ~1,900 points
This offers a favorable risk/reward setup for short sellers.
✅ Candlestick Behavior:
Reversal candles appear near the resistance area, confirming possible trend exhaustion.
📊 Conclusion:
This setup indicates a high-probability short trade below 33,200, with confirmation needed through price weakness.
A strict stop loss at 33,707 should be maintained to manage risk effectively.
EGX30 trade ideas

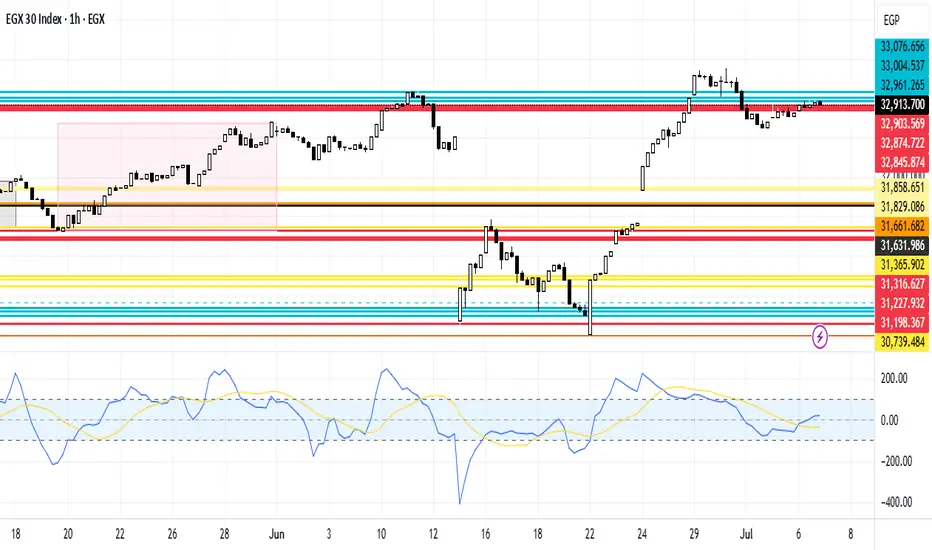
EGX30 Neutrality ZoneEGX30 stock is currently in a neutral region. In case of deceasing, it's expected to break the support line 32,903.569, 32,74.722 and 32,845.874. In case of increasing, it's expected to breach the resistance line 32,961.265, 33,004.537 then 33,076.656
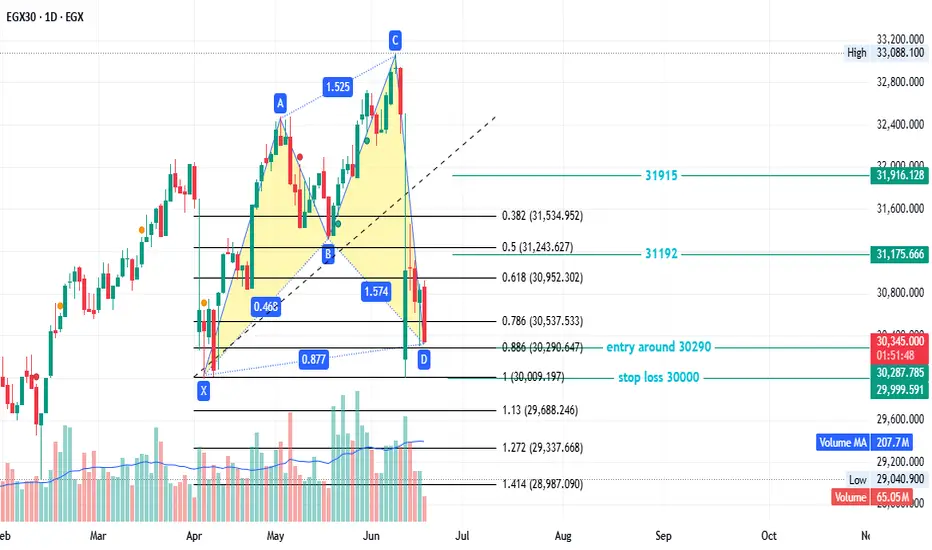
EGX30 - good newsEGX30 created a bullish pattern
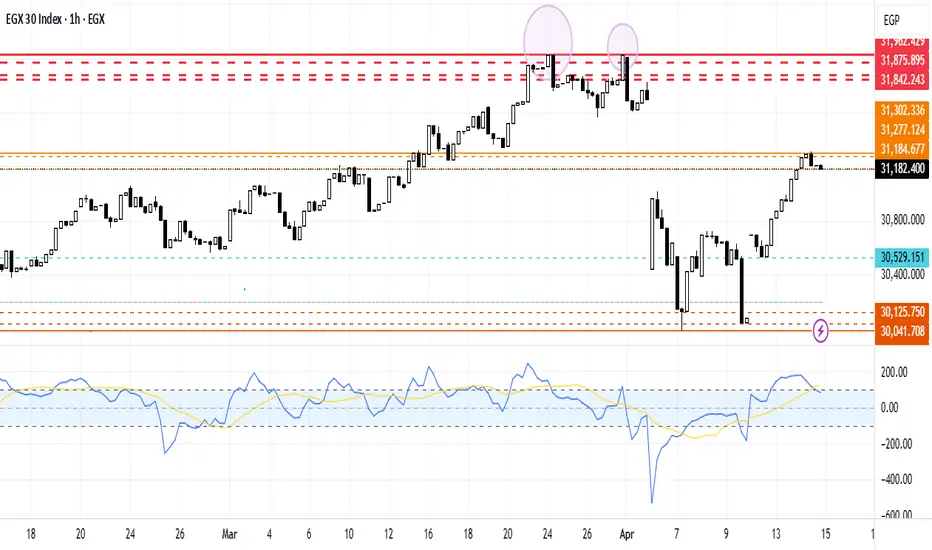
entry around 30290
stop loss 30000
first target 31192
secund target 31915
This is not investment advice—only my analysis based on chart data. Consult your account manager before investing. Good luck!
EGX30 in a Lower RegionEGX30 stock is currently in a decreasing region. It's expected to rebound as historically on the short term it didn't brak the support line 30,238.217. Accordingly, it's expected to rebound to reach the resistance line 30,604.998 to reach then 2nd at 30,690.58 then the third at 30,739.484

Rebound of EGX30EGX30 stock is currently in an increasing region. In case of falling, it's expected to break the support line 32,892.565 to reach then 2nd at 32,568.193 then the third at 32,543.242. In case of rising, it's expected to rebound at the resistance line of 32,934.151, to reach the 2nd at 32,875.931 then the 3rd at 32,850.979

EGX30 Current Region AnalysisEGX30 stock is currently in a neutral region. In case of falling, it's expected to break the support line 32,498.905 to reach then 2nd at 32,408.426 then the third at 32,376.503. In case of rising, it's expected to breach the resistance line 32,546.761, to reach then 2nd at 32,621.248 then the 3rd at 32,695.736

EGX 30 bird view:* White line (trend): Breakout = Long.
* Purple line (resistance): Breakout & confirmation = Long, target 34,450 resistance.
* Orange line (annual resistance): Breakout = Short.
* Blue line (cup & handle): Breakout 18 Feb, confirmed 5 April.

EGX30 Increases by 0.62%EGX30 stock has jumped to an upper region, and it's apparent that this has been a gradual upward trend due to a mutual connection between positive fundamental news and the technical candlestick analysis. It has already breached the resistance line of 32,621.248 and reached the maximum at 32,695.736 points. On a personal level, I expect it to rebound not because of any negative news but because of taking into consideration the short-term history patterns. In case of rebounding, it may reach the support line 32,536.119, the support line 32,408.426, then the support line 32,376.503. In conclusion, EGX30 is increasing in the pink region by 0.62%.

EGX30 Movement AnalysisEGX30 stock is currently in a higher region than before. Unfortunately it rebounded to the support line 31,907.926. In the case of continuing downward it's expected to reach the support line 31,858.651 then break the support line 31,829.086. In case of taking an upward trend, it is expected to breach the resistance line at 31,907.926 and then reach the resistance line at 31,947.346. And reach the third resistance line at 32,095.170 points.
EGX30 in a Higher RegionEGX30 stock is currently in a higher region than before. In the case of taking an upward trend, it is expected to breach the resistance line at 32,026.185 and then reach the resistance line at 32,055.750. And reach the third resistance line at 32,095.170 points. In case of falling, it's expected to break the 1st support line 31,976.910 points, then the 2nd support line 31,947.346, then the 3rd support line 31,907.926. It's an outstanding performance among the current situation, which is fulfilled with news like Egypt's blue-chip index EGX30 was up for a fourth consecutive session, rising 0.2% with E-Finance for Digital gaining 3.2% and Palm Hills development reaching 3.4% besides signing an agreement to develop 1.87 million SQM plot of land in Abu Dhabi. On the other side, Gulf markets declined following the latest tariff threat on European Union goods and the statement on Truth Social on Friday recommended a 50% tariff from June 1 on all EU goods sent global markets roiling.

The EGX30 index is performing wellThe EGX30 index is performing well, though it will probably face some resistances. It's likely the EGX30 will fill the gap and could rise to 31,200. A closing price near that level would break the downward trend. Then, with strong upward movement from hitting the 61.8% Fibonacci retracement level, it might retest 32,480, potentially reaching a target of 32,900.

EGX30 Trend Line AnalysisEGX30 stock is currently falling but rebounded at the support line 31,365.902. In case of taking an upward trend it is expected to breach the resistance line at 31,543.291, then reach the resistance line at 31,681.261. In case of falling it's expected to break the 1st support line 31,316.627 then the 2nd support line 31,227.932, then the 3rd support line 31,198.367

EGX30 Downward Trend Line AnalysisEGX30 stock is falling, reflecting the sellers' dominance over the buyers. In case of taking an upward trend it is expected to breach the resistance line at 31,720.681, then the 2nd resistance line at 31,769.956 then 3rd resistance line at 31,819.231 points, but in case of falling it's expected to break the 1st support line 31,704.167 then the 2nd support line 31,661.682, then the 3rd support line 31.631.986

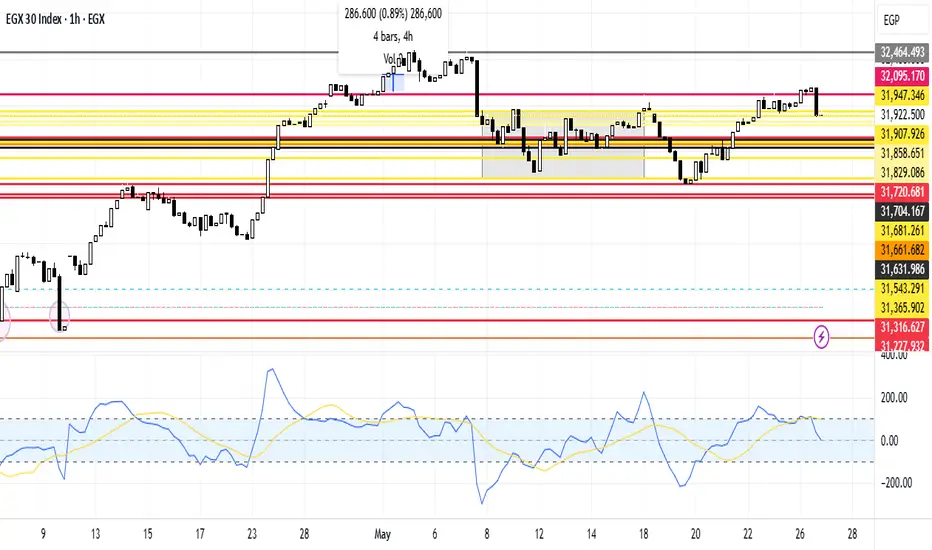
EGX30 Neutral Zone AnalysisEGX30 stock is currently in a neutral zone, between the 31,970 resistance line and 31,424.07 support line, reflecting the buyers' and sellers' wait and taking their time for market analysis, especially with the investment atmosphere that is full of unaligned points of view. In case of taking an upward trend, it is expected not to breach the resistance line at 32,464.493 points, but in case of falling, it's expected not to break the support line at 29,989.245.

EGX30 is correcting and has reached a key Fibonacci levelEGX30 is correcting and has reached a key Fibonacci level from its last low. It may fill three gaps before reversing. I expect a bounce from the trend line below.

EGX30 Downward Trend AnalysisEGX30 stock started to fell reaching the 31,661.82 support line, showing the sellers' dominance over the buyers. This is a result of investors' waiting for the outcome of U.S.-China trade talks on the weekend. In addition, blue-chip developer Emaar Properties reported Q1 net profit of 3.71 billion dirhams that missed the analysts' estimate of 4 billion dirhams.

EGX30 Trend AnalysisEGX30 stock started to fall, reaching the 32,383.579 support line, the 32,343.473 support line, and the 32,283.315 support line, showing the sellers' dominance over the buyers. This is because investors are cautious about the U.S. meeting with many countries, including China, on trade deals, aiming to secure a fair trade deal. In addition, it was expected that the EGX30 would not breach the resistance line 32,463.789, as there is no historical upward trend in this zone.

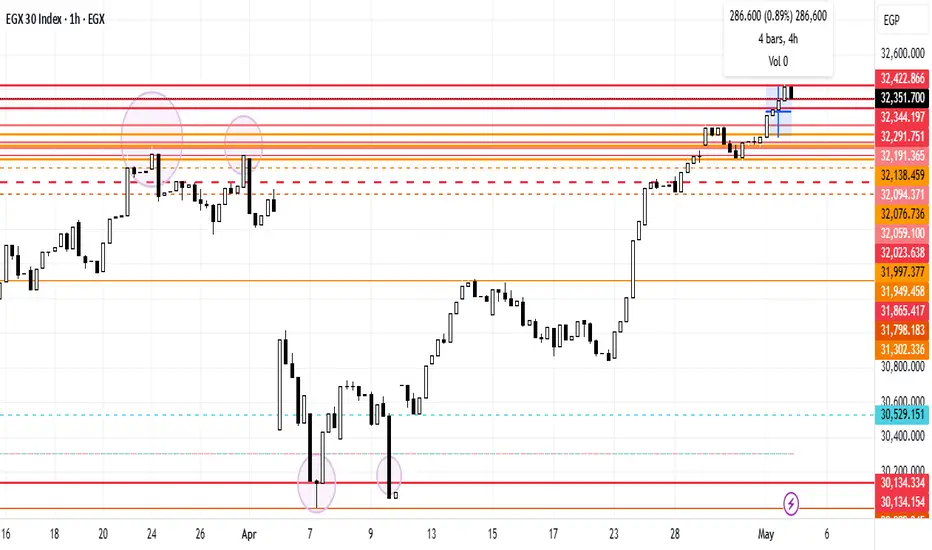
EGX30 Chart AnalysisEGX30 stock has shifted gradually to a higher zone, reaching the 32,291.751 resistance line, the 32,344.197 resistance line, and the 32,422.866 resistance line, showing the buyers' dominance over the sellers. Additionally, the upward trend is because Egypt's blue-chip index EGX30 closed 0.7% higher, which led to a 1.6% increase in TMGH, which strengthened the fundamental analysis about the CBE's decision about cutting the interest rate and the advanced massive ads and negotiations initiated by TMGH with different aspects.
EGX30 Upward TrendEGX30 stock shifted to a higher zone, between 32,191 resistance line and 32,006 support line, reflecting the buyers' dominance over the sellers'. It is expected to not breach the resistance line at 32,191 points since that there is no historical trend, but in case of falling it's expected to reach the support line 32,147 then 32,094 then 32,006 points.

The Central Bank of Egypt's Decision Impact on EGX30EGX30 stock shifted to a new zone, between the 31,865 resistance line and 29,991 support line, reflecting the buyers' dominance over the sellers'. It is expected to reach the resistance line 31,949 then 32,025, and in case of falling, it's expected to reach the support line 31,831 then 31,798. In addition, this zone is a result of the decision of The Central Bank of Egypt concerning the interest rate cut that was expected by most investors which didn't recognizably impact the stock market.

Egypt’s Sovereign Debt: A High-Yield Opportunity for InvestorsEmerging markets often present a delicate balance of risk and reward, and Egypt’s sovereign debt market is no exception. In recent years, Egypt has undergone significant economic reforms, positioning its government bonds as an attractive option for yield-hungry investors. With double-digit yields and a stabilizing economic backdrop, Egypt’s bonds offer a compelling case for those willing to navigate the associated risks. This article explores why Egypt’s sovereign debt is worth considering in 2025.
Attractive Yields Amid Market Shifts
Egypt currently has 18 outstanding sovereign bond issuances in foreign currencies—16 in U.S. dollars and 2 in euros. These bonds have recently caught investors’ attention due to their elevated yields, which have climbed into double-digit territory. For instance, a dollar-denominated bond maturing in 2029 offers a yield of 10.2%, while its euro-denominated counterpart yields 9.6%. These figures reflect a notable increase from earlier levels of 8–9%, driven by recent political uncertainties in the region. For investors seeking high returns, these yields are hard to ignore, especially especially in comparison to other emerging markets with similar credit ratings.
A Stable Rating with Room for Growth
Egypt’s sovereign credit rating stands at B with a stable outlook, as reaffirmed in November 2024 when it was upgraded from B- to B. This rating reflects a cautious optimism about the country’s economic trajectory, though it is constrained by persistent inflationary pressures. Inflation in Egypt currently sits at 13.6% as of March 2025, a significant improvement from peaks of 24–27% in previous years. However, this rate remains higher than in peer countries with a B rating, limiting further upgrades for now. If inflation were to fall to 5% or below, a rating improvement could unlock additional upside for bond prices.
Economic Reforms Bolster Confidence
Several factors underpin the appeal of Egypt’s bonds beyond their yields. First, the country has embarked on a privatization drive, moving away from its historically military-dominated economy. Post-Arab Spring, many enterprises were state-controlled with tax privileges, but recent reforms aim to transfer these assets into private hands. A notable example is the 2024 IPO of United Bank of Egypt, where the central bank sold a 30% stake, signaling a commitment to reducing state ownership.
Second, Egypt’s international reserves have grown impressively, rising from $12 billion in 2024 to $45 billion currently. This bolstered reserve position enhances the country’s ability to service its external debt, reducing default risk for bondholders. Additionally, Egypt has adhered to an IMF-backed economic recovery program, which includes maintaining a flexible exchange rate. For over a year, the central bank has refrained from currency interventions, allowing market forces to determine the Egyptian pound’s value-a key IMF condition that has strengthened investor confidence.
Inflation and Interest Rate Dynamics
Inflation, though still high at 13.6%, has been trending downward from its 2023–2024 highs of 24–27%. The central bank forecasts further declines, potentially accompanied by a reduction in the key interest rate. Lower rates could spur deposit growth in Egyptian banks, with funds likely flowing into government securities. This dynamic could drive up bond prices in 2025, offering capital gains on top of the already attractive yields. For investors holding bonds at current levels (e.g., 10.5% yield), this presents a dual opportunity for income and price appreciation.
Risks to Consider
Despite the positive developments, investing in Egypt’s sovereign debt is not without risks. There are three primary concerns stand out to note:
High Key Interest Rates: If the central bank struggles to lower rates, the government’s borrowing costs will remain elevated, straining its ability to reduce the debt-to-GDP ratio (currently at 86%, down from 91% last year).
Currency Policy Reversal: A return to a fixed exchange rate regime could signal economic distress, deterring foreign investors and weakening reserves.
Geopolitical and Tourism Risks: Egypt’s economy relies heavily on tourism and Suez Canal revenues. Any regional conflict or global downturn could disrupt these income streams, impacting fiscal stability.
Comparative Appeal
When benchmarked against other B-rated sovereigns, Egypt’s bonds appear undervalued. For comparison, Cameroon, also rated B, offers an 11% yield for bonds maturing in 2031, while Armenia (B+) yields 6.7% for a similar duration. Egypt’s higher yield relative to its rating, combined with its reform momentum, makes it a standout choice. Investors may find greater comfort in Egypt’s economic trajectory compared to less familiar markets like Cameroon.
Conclusion
Egypt’s sovereign bonds offer a rare combination of high yields and improving fundamentals, making them a compelling option for emerging market investors in 2025. The country’s privatization efforts, growing reserves, and IMF-backed reforms provide a solid foundation, while declining inflation and potential rate cuts could further boost bond prices. However, risks tied to interest rates, currency policy, and regional stability warrant careful consideration. For those seeking yield in a volatile global environment, Egypt’s debt market presents a balanced opportunity worth exploring.

The Effect of US Tariff Exemptions on EGX30.EGX30 stock stabilized in a consolidation zone, failing to breach the 29991 support line. Despite breaking the 30041 support line to the downside, it corrected its upward trajectory between the 30529 support line and the 31302 resistance line, reflecting the bulls' dominance over the bears. This is because Egypt agreed to work towards a package of $7.5 billion in direct Qatari investments, according to a joint statement released by the Egyptian president's office on Monday. In addition, Egypt is pushing ahead with efforts to secure funding from Gulf neighbors and foreign partners as it seeks to tackle heavy foreign debts and a gaping budget deficit.
EGX30 - Egyptian market index - good news#EGX30 - time frame 1 DAY
created 2 Bullish pattern ( Gartley and AB=CD ) , Action price in this point already done ,but in anther hand we are still in a downtrend targeted 28050 to 27000 unless closed weekly uber 32200 .
now we have a chance to improve our investment as follow :
Entry level at 28515 ( already done , closed today at 28967 )
Stop loss 28515 ( daily close , may index achieve this target but close uber it )
First target at 29700 ( if index close uber 29700 it will be good support )
there is resistance point at 30200 before achieve next target
Second target 30500
Third target 31000 ( if index achieved this target and closed weekly uber it , It will be a good indicator of the beginning of entering an upward phase and the end of the decline )
NOTE : this data according to time frame I DAY ,
NOTE ; EGX30 still have lower target up to 27000 so my advice is don't be Very optimistic but be careful .
Its not an advice for investing only my vision according to the data on chart
Please consult your account manager before investing
Thanks and good luck
