EKHOA - only for share holders / not for new entry .EGX:EKHOA - 1 day timeframe
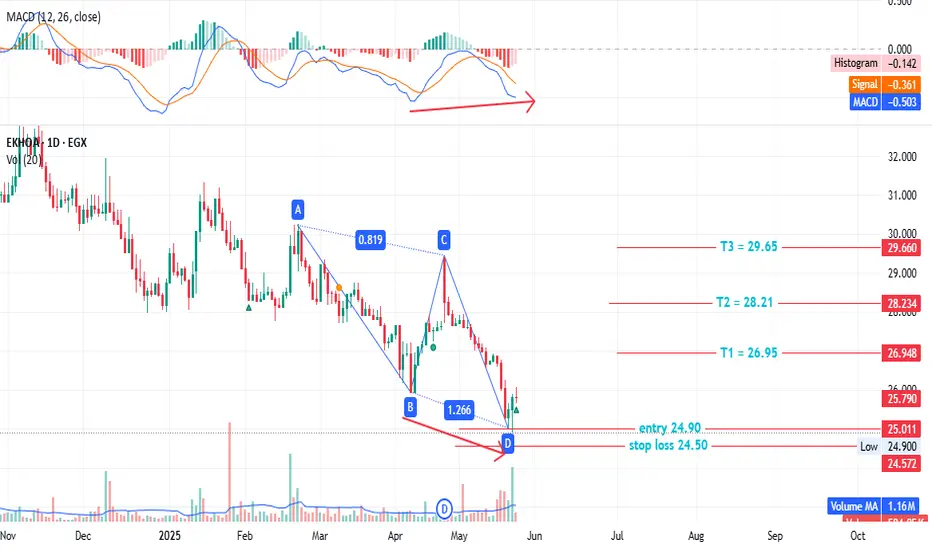
Bullish AB=CD pattern formed / For shareholders only
Stop loss: 24.50
T1: 26.95
T2: 28.21
T3: 29.65
Entry: around 25.00
MACD shows positive divergence daily, with increased volume over the past week, supporting our view.
Note: The stock has been in a downtrend and re
Next report date
—
Report period
—
EPS estimate
—
Revenue estimate
—
0.113 USD
133.65 M USD
601.08 M USD
525.94 M
About EGYPTIAN KUWAITI HOLDING
Sector
Industry
Website
Headquarters
Giza
Founded
1997
ISIN
EGS69082C013
FIGI
BBG000BTV892
Egypt Kuwait Holding Co. SAE engages in investment management services. It offers a portfolio of investments in the business lines of fertilizers and petrochemicals, energy, cement production, insurance, information technology, transport, and infrastructure. The company was founded on July 20, 1997 and is headquartered in Giza, Egypt.
Related stocks
#EKHOA - only for share holders / not for new entry .EKHOA - 1 day timeframe
Bullish AB=CD pattern formed / For shareholders only
Stop loss: 24.50
T1: 26.95
T2: 28.21
T3: 29.65
Entry: around 25.00
MACD shows positive divergence daily, with increased volume over the past week, supporting our view.
Note: The stock has been in a downtrend and

EKHOA .....Let's SeeEKHOA, let's see if this analysis would be valid or not. I think 28 level will be the base to go up to reach 38.42, then 48.72 then 59 as third target.

#EKHOA Egyptian stock - great opportunity - great fundamental.#EKHOA time frame 1 DAY
created 3 Bullish Gartley patterns ( patterns by time frame 1 day and anther one by time frame 1 hour ) , so we can see action price in this point but in anther hand we are in a downtrend targeted 27.00 .
Entry level at 30.10 to 30.30
Stop loss 29.00 ( loss may go to up -3.

#EKHOA#EKHOA time frame 15m
created a bullish Gartley pattern
entry level at 31.80 TO 31.90
stop loss 31.75
first target at 32.10
second target 32.30 up to 32.45 , 32.60
MACD indicator show positive diversion , may that is support our idea.
NOTE : this data according to time frame 15m
Its not an advice

Time analysis for EKHOBased of the arc and the time mirror effect. We can detect the end of the sideway area near to one of the lines of the chart Or between them . then if we started up trend we can expect the top near to the right lines.
you will need normal technical analysis to support it when the time come.

Egyptian Kuwaiti is preparing for a nice breakoutDaily chart, the stock EGX:EKHOA is drawing a chart pattern, where the targets up to 41 and 44 will be activated after crossing the resistance zone 31 - 32
The technical indicators RSI and MACD are supporting this view.
Consider a stop loss below 29.5 - 29

EKHO (Egypt) should rebound to 0.750 short-term1-hour chart, EGX:EKHO is trading in a falling wedge.
I am expecting a rebound from this zone 0.720 - 0.725
Closing for 3 hours above 0.725 will push the price to 0.750 passing through some resistance levels 0.732 , 0.740
Currently, the chart's technical Indicator RSI is inclined towards over-sol

EKHOA OUTLOOKWelcome to the daily analysis of EKHOA, a key constituent of the EGX30 index. This analysis provides insights into market movements and potential trading opportunities based on a comprehensive approach utilizing various technical indicators. The analysis is grounded in the following methods:
Ichi

Time analyses of EKHO we expect a change in trend in this dates depend on the arc and time cycles of the stock.

See all ideas
Summarizing what the indicators are suggesting.
Neutral
SellBuy
Strong sellStrong buy
Strong sellSellNeutralBuyStrong buy
Neutral
SellBuy
Strong sellStrong buy
Strong sellSellNeutralBuyStrong buy
Neutral
SellBuy
Strong sellStrong buy
Strong sellSellNeutralBuyStrong buy
An aggregate view of professional's ratings.
Neutral
SellBuy
Strong sellStrong buy
Strong sellSellNeutralBuyStrong buy
Neutral
SellBuy
Strong sellStrong buy
Strong sellSellNeutralBuyStrong buy
Neutral
SellBuy
Strong sellStrong buy
Strong sellSellNeutralBuyStrong buy
Displays a symbol's price movements over previous years to identify recurring trends.
Frequently Asked Questions
The current price of EKHO is 0.666 USD — it has increased by 0.60% in the past 24 hours. Watch EGYPTIAN KUWAITI HOLDING stock price performance more closely on the chart.
Depending on the exchange, the stock ticker may vary. For instance, on EGX exchange EGYPTIAN KUWAITI HOLDING stocks are traded under the ticker EKHO.
EKHO stock has risen by 1.37% compared to the previous week, the month change is a 3.34% rise, over the last year EGYPTIAN KUWAITI HOLDING has showed a −5.97% decrease.
We've gathered analysts' opinions on EGYPTIAN KUWAITI HOLDING future price: according to them, EKHO price has a max estimate of 1.62 USD and a min estimate of 0.95 USD. Watch EKHO chart and read a more detailed EGYPTIAN KUWAITI HOLDING stock forecast: see what analysts think of EGYPTIAN KUWAITI HOLDING and suggest that you do with its stocks.
EKHO reached its all-time high on Jan 29, 2006 with the price of 3.930 USD, and its all-time low was 0.232 USD and was reached on Jun 3, 2001. View more price dynamics on EKHO chart.
See other stocks reaching their highest and lowest prices.
See other stocks reaching their highest and lowest prices.
EKHO stock is 0.76% volatile and has beta coefficient of 0.18. Track EGYPTIAN KUWAITI HOLDING stock price on the chart and check out the list of the most volatile stocks — is EGYPTIAN KUWAITI HOLDING there?
Today EGYPTIAN KUWAITI HOLDING has the market capitalization of 551.68 M, it has increased by 0.15% over the last week.
Yes, you can track EGYPTIAN KUWAITI HOLDING financials in yearly and quarterly reports right on TradingView.
EGYPTIAN KUWAITI HOLDING is going to release the next earnings report on Aug 11, 2025. Keep track of upcoming events with our Earnings Calendar.
EKHO net income for the last quarter is 27.61 M USD, while the quarter before that showed 27.40 M USD of net income which accounts for 0.77% change. Track more EGYPTIAN KUWAITI HOLDING financial stats to get the full picture.
Yes, EKHO dividends are paid annually. The last dividend per share was 0.04 USD. As of today, Dividend Yield (TTM)% is 5.02%. Tracking EGYPTIAN KUWAITI HOLDING dividends might help you take more informed decisions.
EGYPTIAN KUWAITI HOLDING dividend yield was 4.36% in 2024, and payout ratio reached 29.43%. The year before the numbers were 7.60% and 44.52% correspondingly. See high-dividend stocks and find more opportunities for your portfolio.
EBITDA measures a company's operating performance, its growth signifies an improvement in the efficiency of a company. EGYPTIAN KUWAITI HOLDING EBITDA is 203.46 M USD, and current EBITDA margin is 34.80%. See more stats in EGYPTIAN KUWAITI HOLDING financial statements.
Like other stocks, EKHO shares are traded on stock exchanges, e.g. Nasdaq, Nyse, Euronext, and the easiest way to buy them is through an online stock broker. To do this, you need to open an account and follow a broker's procedures, then start trading. You can trade EGYPTIAN KUWAITI HOLDING stock right from TradingView charts — choose your broker and connect to your account.
Investing in stocks requires a comprehensive research: you should carefully study all the available data, e.g. company's financials, related news, and its technical analysis. So EGYPTIAN KUWAITI HOLDING technincal analysis shows the buy rating today, and its 1 week rating is neutral. Since market conditions are prone to changes, it's worth looking a bit further into the future — according to the 1 month rating EGYPTIAN KUWAITI HOLDING stock shows the sell signal. See more of EGYPTIAN KUWAITI HOLDING technicals for a more comprehensive analysis.
If you're still not sure, try looking for inspiration in our curated watchlists.
If you're still not sure, try looking for inspiration in our curated watchlists.