Misr Cement Qena should target 29.5 then 36.0 and 38.0Daily chart,
the stock EGX:MCQE has formed a triangle chart pattern, and the target is 36.0 then 38.0
29.5 and 32.9 are resistance levels.
Technical indicator MACD is positive and crossed its signal line.
RSI is showing a probability to have a minor correction before resuming the bullish movement.
Closing below 26.5 - 26.0 for 2 days should be a stop loss level on the daily time frame.
Note : New buy entry after 28.8 (2 days close) or around the support zone 26.5 - 26.0
MCQE trade ideas

#MCQE Egyptian stock#MEQE time frame 15m
created a bullish Gartley pattern
entry level at 25.40 to 25.60
stop loss 25.30
first target at 26.40 to 26.60
second target 27.00 up to 27.20 and 27.60
accumulation and distribution line indicator show positive diversion , may that is support our idea.
in addition at time frame 1 hour showed the same pattern with same results
NOTE : this data according to time frame 15m
Its not an advice for investing only my vision according to the data on chart
Please consult your account manager before investing
Thanks and good luck


Reverse from Supply ZonePrice has been dropped from the supply zone, I think it will drop to mid zone at 16 LE and them then go up.

NEXT MARKET MOVE UP TO 2023NEXT MARKET MOVE UP TO 2023
At the bold black line, a major area,
At the orange line, a sub area
WE CAN UPDATE AFTER BROKEN

Buying in Qena now! Rewarding or Risky!Qena is going to get its targets by tomorrow or in a couple of days if that bullish continued, who knows!
we just need more bullish as shown to prove that it crossed the downtrend channel, buying it now may be risky and rewarding as a bullish flag appears in the daily chart so be cautious!
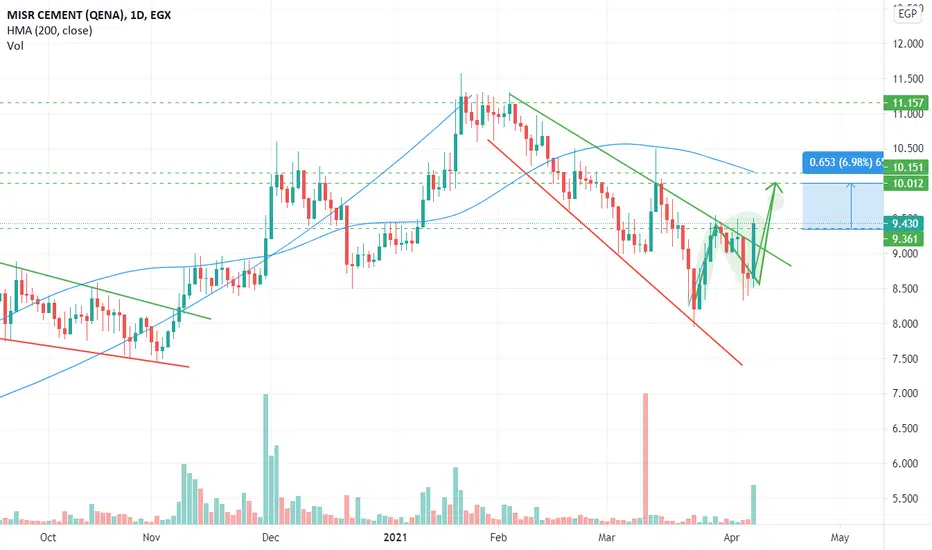
Decrypting the Algo..This Analysis was Hand Made.. but it is more accurate than the indicator as its buggy...
if we manage to close above the 9.41 we test 10.4* and watch what happens on 12 april ;)
support and resistance lines..
horizontal lines are Support/Resistance .
Vertical lines are time pivots .
Appreciate your Comments.
GL

