MISR FERTILIZERS The stock of Mobco is in a downward trend, forming a large double top pattern with a peak at 79.26EGP and another at 78.98 EGP. The neckline has been broken, and now we have a flag pattern that has been broken downwards. The targets are as indicated. We expect the formation of a corrective wave, as shown, or a rapid decline. We will monitor the downward movement. The stop-loss will be a break of the strong supply zone and a breakout above 57 EGP, closing above this level after compelet correction target new peak above 80EGP.
MFPC trade ideas

MFPC Short Hello Everyone,
Have checked this stock for a shorter term opportunity on the 4h tf. The stock seems was way way way over valued and made a huge run to the upside, then now is on the way down. This downtrend only tells that buyers are not that interested on this stock at those prices, along side those who made profits from the initial run up to the upside, which now closing their positions.
Now there are entities and individuals who would love to buy this stock at lower prices, thus it only means that the stock in itself is worth the money (based on the chart and not any fundamentals, as i dont read enough about companies nowadays).
The chart this time shows two different opportunities. The first one is long and the second one is short.
The long opportunity comes as poison in honey (as we Egyptians say), its a reversal trade and going against the trend thus the stoploss is so tight and the target is marked by the yellow arrow.
Now the short opportunity comes as free money laying around, waiting to be taken. There is a short price gap, which likely to be filled, then there will be a liquidity sweep @ 50.9. Then its on.
Do your own research, and find out if the company has any upcoming news that might move the price up or down, also remember to DYOR. This is a lucrative opportunity i think, but without reading about the fundamentals then its not worth it.

Emerging Bullish harmonic Emerging Bullish harmonic patterns are forming but i think there will be one last bearish move before we start the coming bull move . The break out of the triangle will determine the new direction of move

#MFPC #EGX30 Egyptian stock anther gartly pattern appeared on MFPC MOPCO
so according to below chart (time frame daily)
entry level 40.50
target 1 = 41.50
target 2 = 42.50
stop loss = 40.00 (daily close)
note : this data according to time frame daily
note : EGX30 is negative
Its not an advice for investing only my vision according to the data on chart
Please consult your account manager before investing
Thanks and good luck

Misr Fertilizers (MOPCO) has a potential to 54Weekly chart, the stock EGX:MFPC was pumped to the 70's then dropped sharply to 35.
It has started a rebound, expected to 51, then 54
Stabilizing for 2 weeks with high volume trading above 55, the target will be 66 - 68
Be careful, the stop loss should be considered as near as possible.

Analysis of Shariaa index, ADIB, MFPC, TALM, & ISPHanalysis performed using the following strategies and indicators:
Ichimoku Kinko Hyo
Law of diminishing returns
Volume price trend
Relative Strength Index (RSI)
Average True Range (ATR)
Linear Regression

Mfpc Advanced Jinny Gann GridHello Dear Traders,
Wish you a good Day,
on The chart important Levels "Horizontal levels" Based Works as Support/Resistance
Watch for Price action around those levels.
also there are Jinny Gann grid the gray trends works as close as Channels in your regular Classic analysis.
Trade around the levels and be as close as possible to take action around it.
Produced by Jinny Gann Ar.
Best Regards

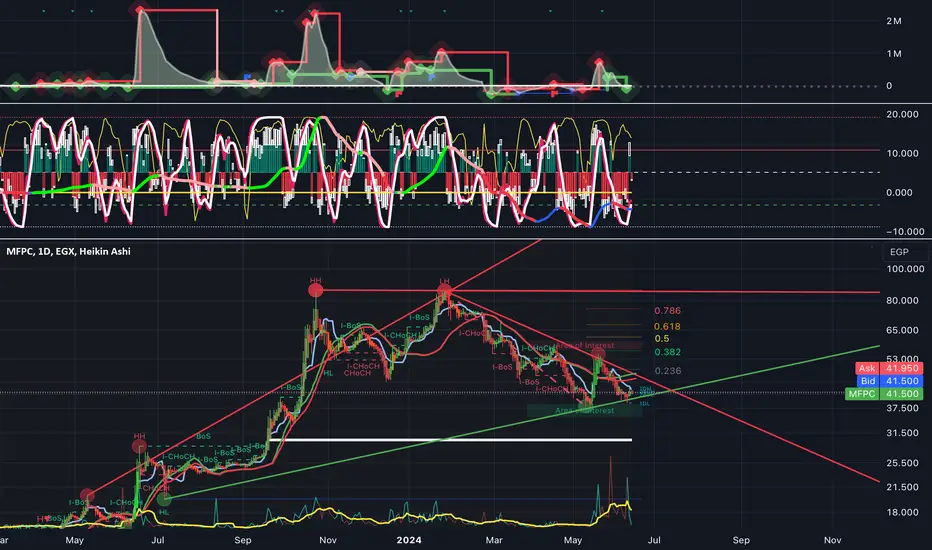
Analysis of MFPC Stock with Outlook
The MFPC stock chart presents a detailed technical analysis using various indicators and overlays. The Volume Price Trend (VPT) indicator at the top shows cumulative volume adjusted for price changes, revealing significant buying and selling pressure through its peaks and troughs. The Efforts vs. Results indicator below highlights the relationship between volume and price movements, where oscillations and crossovers can signal potential reversals or trend continuations.
The main price chart, which uses Heikin Ashi candles, smooths out price action to make trends more apparent. Green lines indicate rising trends, while red lines denote downtrends. The stock is currently trading at 41.870 EGP, reflecting a slight decline of 1.19%. The chart also includes a Moving Average (MA 9) for short-term trend identification and a volume line indicating the traded volume during each period.
Annotated on the chart are key price levels and patterns, such as Higher Highs (HH) and Lower Highs (LH), which signal trend reversals. Labels like Break of Structure (BoS) and Change of Character (CHoCH) mark significant shifts in market structure. Fibonacci retracement levels (0.236, 0.382, 0.5, 0.618, 0.786) are drawn to identify potential support and resistance levels.
Outlook for Tomorrow
For tomorrow’s trading session, the immediate outlook for MFPC stock suggests cautious optimism. The stock is near a key support level around 41 EGP, which it has tested and held multiple times. If the support level continues to hold and the volume increases, there could be a potential reversal or a bounce-back. Traders should watch for a break above the 43 EGP level, which would indicate the beginning of a recovery phase. Conversely, if the stock breaks below 41 EGP with increased selling volume, further declines could be expected, with the next support level possibly around 38 EGP.
Advice for Investors Who Bought Around 50 EGP
Investors who bought MFPC around 50 EGP are currently facing a significant unrealized loss. For these investors, the key is to closely monitor the support and resistance levels mentioned. If the stock begins to show signs of recovery and breaks above 43 EGP, it might be worth holding on to the stock for a potential further recovery. However, if the downward trend continues and the stock breaks below 41 EGP, investors might consider setting stop-loss orders to limit further losses. Long-term investors should also consider the company’s fundamentals and any upcoming news or earnings reports that could impact the stock’s performance.
In summary, while the MFPC stock is in a downtrend, the support at 41 EGP and volume trends provide a glimmer of hope for a reversal. Tomorrow’s session could be crucial, and investors should stay vigilant, particularly those who bought at higher levels around 50 EGP.
EGX30, A Comprehensive AnalysisNavigating Trends: A Comprehensive Analysis of Market Indices for Enhanced Decision-Making
The EGX30 is currently consolidating following a significant 9% uptrend, aligning back with the trend line. Although today's Heikin Ashi candlestick is red for the second consecutive day, it is shorter than the previous one following the 9% rally. The support at 26,950 remains crucial, while the next short-term target is 28,000.
---
Introduction:
In this educational video, a comprehensive technical analysis strategy is presented, emphasizing the identification of trend reversals and entry points in the market. The strategy integrates a variety of indicators and concepts to enhance trading accuracy and decision-making.
Key Components:
1. Indicators Used:
- Fibonacci Retracement (Fibonacci)
- Average True Range (ATR)
- Cumulative Volume Delta
- Smart Money Concepts
- Relative Strength Index (RSI)
- Trailing Stop Loss ATR
- Ichimoku Kinko Hyo (Ichimoku)
2. Objective:
The primary aim of the strategy is to identify the shift from a downtrend to an uptrend, enabling well-timed trading decisions. By combining multiple technical tools, traders seek to improve the success rate of their trades.
3. Trading Philosophy:
- The focus on Ichimoku Kinko Hyo as a core element highlights the strategy's reliance on signals from this potent indicator.
- Referring to individuals as "Ichimokians" indicates a commitment to mastering Ichimoku strategies and principles in trading.
Conclusion:
By utilizing a range of indicators such as Fibonacci, ATR, volume analysis, RSI, and Ichimoku together, traders adhering to this approach can develop a comprehensive view of market dynamics. Employing these tools collectively enhances the ability to identify optimal entry and exit points, providing a solid basis for strategic and well-informed trading decisions.
This video encapsulates the essence of the educational material, offering insights into the advanced technical analysis approach supported by the "ICHIMOKUontheNILE" community.
"Disclaimer: Investing in the stock market carries inherent risks. The information provided here is for educational purposes only. It does not constitute investment advice. The content is intended to demonstrate how to interpret market indices and identify confluence points for informational purposes only. Any investment decisions made based on this content are at the individual's own risk."

MFPC (MOPCO)22-5-2024 echnical Analysis Report: Advanced Trading Strategies Using Multiple Indicators
Introduction:
In this educational video, a comprehensive approach to technical analysis is presented, focusing on the identification of trend reversals and entry points in the market. The strategy incorporates a diverse set of indicators and concepts to enhance trading precision and decision-making.
Key Components:
1. Indicators Utilized:
- Fibonacci Retracement (Fibonacci)
- Average True Range (ATR)
- Cumulative Volume Delta
- Smart Money Concepts
- Relative Strength Index (RSI)
- Trailing Stop Loss ATR
- Ichimoku Kinko Hyo (Ichimoku)
2. Objective:
The primary goal of the strategy is to pinpoint the transition from a downtrend to an uptrend, facilitating well-timed trading decisions. By combining various technical tools, traders aim to increase the probability of successful trades.
3. Trading Philosophy:
- The emphasis on Ichimoku Kinko Hyo as a foundational element underscores the strategy's commitment to deriving signals from this powerful indicator.
- The reference to being an "Ichimokian" reflects a dedication to mastering Ichimoku strategies and principles in trading practices.
Conclusion:
By integrating a spectrum of indicators such as Fibonacci, ATR, volume analysis, RSI, and Ichimoku, traders following this methodology can gain a more holistic view of market dynamics. The utilization of these tools in conjunction with each other enhances the ability to identify optimal entry and exit points, laying a strong foundation for informed and strategic trading decisions.
This video encapsulates the essence of the educational content, offering insights into the advanced technical analysis approach advocated by the "ICHIMOKUontheNILE" community.

time analyses of MFPC we expect change in trend in this dates depend on the arc and time cycle of the stock

Multi timeframe analysis weekly to 5 minutesAnalysis is based on Ichimoku, and Elliot waves. Confirmation is done by other indicators such as MACD, stochastic RSI, OBV, and RedK Everex. HeatMap & Stock screener are presented.
Watch the video idea to have the full picture of the stock under analysis.
watch the video for more details
Disclaimer:
The Content is for informational purposes only, you should not construe any such information or other material as legal, tax, investment, financial, or other advice.
There are risks associated with investing in stocks, and might involve risk of loss. Loss of principal is possible. Investors should note that past performance is not a guarantee of future returns. The investment value may be affected by market fluctuations.
The stocks mentioned here are not equivalent to, nor should it be treated as a substitute for, time deposit or any other form of saving deposits.
Investment in the securities of smaller companies can involve greater risk than is generally associated with investment in larger, more established companies that can result in significant capital losses.

confirmation of end of Wave A if wave A ended, moderate Target 56EGP
today is critical day.
Details are in the video

MFPC visited the post split priceEnd of trading session, THE strong buyer was present.
Targeting 72EGP price bar Sunday , if crossed the RED KUMO with strong volume.

MFPC bullishpositive outlook
crossing Green Kumo opens the gateway to heaven 89-110 consecutively
FVG @ 72 is a challenge
Bearish OB between 72-83
Fundamentals analysis is your KSF (key success factor)

77K bought @14:25 will change the market structureBuyers' confidence that MPCO reached its bottom price @74.6 -74.9, will lead to the upswing

Liquidity isn't presentTrading above the the bullish order block
Poor daily volume
Resistance + 75.20, 75.75, and 76EGP
RULE of THUMB: comi breakout leads to FERTILIZERS eclipse

trendless minor correction in the short-term
still positive outlook .. mid-term & long-term uptrending
can increase position size by buying @FVG levels.

uptrending Green Kumo formation on 5 timeframe, TK Cross 13:50 ... FVG is on the corner.
Positive uptrend, Purchase point 81.5-82, target 83.9 EGP
The key success factor for this idea is the maintaining USD EGP parallel market rate above 65EGP

Sunday 28th of January - Smart Money outlookThe demonstrated concept is based on FVG, Order Block, and Ichimoku Kinko Hyo. The narrative is in Arabic, and channeled toward Arabic speaking trader in CASE.
Disclaimer: this is not an investment proposal; if you want to invest consult your investment/wealth manager.

Misr Fertilizers Production Co SAE (MFPC) - weekly reviewMisr Fertilizers Production Co SAE (MFPC) weekly review is based on Ichimoku Kinko Hyo, and Haikin Ashi.
The narration is in Arabic language & channeled toward Arabic Speaking EGX traders.
Thank you.

MFPC UP TO 1000 !Buy MFPC TO TARGET 1 = 540
After rising and stabilizing above the 540 EGY, the price targets the 1000 EGY
NOTE This is not should not be construed as an offer to sell or the solicitation of an offer to purchase or subscribe for any investment.

MFPCAbove 83 is good as per scenario on the Chart..
I am expecting strong resistance around 95.94 then might retest lower to 83~ then back to 103 - 115
Best Entry was breaking above 83. or if retested and reversed again from it.
Good Luck Everyone.
