MASR is currently below its 200 SMA.MASR is currently below its 200 SMA. Given its tendency since 2023 to quickly reverse after crossing this line, it's best to await clearer price action before considering a safe investment.
Next report date
—
Report period
—
EPS estimate
—
Revenue estimate
—
0.599 EGP
871.14 M EGP
14.31 B EGP
415.33 M
About MM GROUP FOR INDUSTRY AND INTERNATIONAL TRADE
Sector
Industry
CEO
Khaled Gamaluddeen Mohamed Mahmoud
Website
Headquarters
Cairo
Founded
1895
ISIN
EGS75011C014
FIGI
BBG002JVWYY9
M.M. Group for Industry & International Trade SAE engages in the business of producing and assembling vehicles, agricultural tractors and related equipment, loaders, heavy and light means of transportation, and performing overhauls. It operates through the following activity segments: Consumer Electronics, Telecommunication, Automotive, Tractors and Pipes. The company was founded by Khaled Gamaluddeen Mohamed Mahmoud, Salah El-Din Mohamed Mahmoud, and Amin Mahmoud in 1895 and is headquartered in Cairo, Egypt.
Related stocks

MM Group Egypt - Quick trading between S & R lines 1-hour chart,
the stock EGX:MTIE is trading in a rising wedge. While this is a bearish chart pattern, we can trade between the support and resistance lines (7.60 - 8.00) for the next few weeks - or until breaking either boundaries.
In case of:
closing 3 hours below line S, the target will be

MM group We notice a decline in the volume highs as they reach the low volume today, and the sideways movement and stability above the gap all show that we are close to the bottom. Support 6.8
Stop 6.55 with close
Resistance 7 Goals 7.25, 7.5 and 8 are the final goal.
I expect a strong movement this week.

Mtie Market Maker MapHello Dear Traders,
Decrypting The Algos!
Important Levels
On the Chart, "Horizontal Lines" are Based on Gann Square of 9. They work as Support/Resistance. Watch for Price action around those levels.
Jinny Gann Grid
Vertical lines work as timelines. Expect Reversals around them.
Next Near Resista

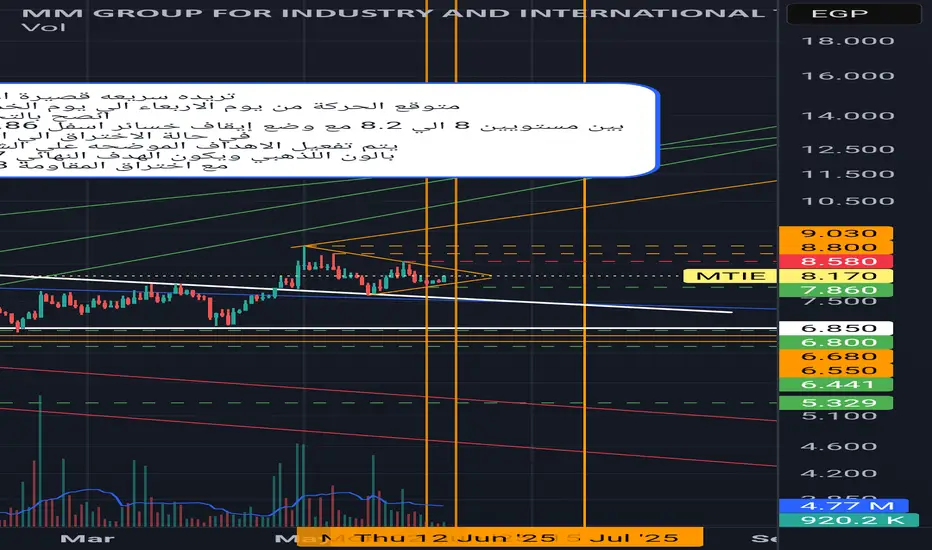
MTIE, Egypt, to target 11.50 weekly chartMTIE , Egypt,
On the weekly chart, crossing 8.20 will push the stock to target 11.50 on stages.
Stop loss level at 5.75 should be actively monitored.

MTIE positive outlookMTIE positive outlook but will consolidate
two more working days isa
targets are explained in the video idea

MM Group is about to cross the resistance; then 11.4Daily chart, the stock has formed an expanding triangle chart pattern, and is preparing to cross the Resistance line (blue).
After crossing, the target will be 11.4
Stop loss should be considered below 6.85

NEXT MARKET MOVE UP TO 2023NEXT MARKET MOVE UP TO 2023
At the bold black line, a major area,
At the orange line, a sub area
WE CAN UPDATE AFTER BROKEN

FIB ChannelsA Simple FIB Channels for the Long-term Uptrend & small Downtrend.
Entry was 6.20
1st Near resistance 6.98
Good Luck For All!

See all ideas
Summarizing what the indicators are suggesting.
Oscillators
Neutral
SellBuy
Strong sellStrong buy
Strong sellSellNeutralBuyStrong buy
Oscillators
Neutral
SellBuy
Strong sellStrong buy
Strong sellSellNeutralBuyStrong buy
Summary
Neutral
SellBuy
Strong sellStrong buy
Strong sellSellNeutralBuyStrong buy
Summary
Neutral
SellBuy
Strong sellStrong buy
Strong sellSellNeutralBuyStrong buy
Summary
Neutral
SellBuy
Strong sellStrong buy
Strong sellSellNeutralBuyStrong buy
Moving Averages
Neutral
SellBuy
Strong sellStrong buy
Strong sellSellNeutralBuyStrong buy
Moving Averages
Neutral
SellBuy
Strong sellStrong buy
Strong sellSellNeutralBuyStrong buy
Displays a symbol's price movements over previous years to identify recurring trends.
Frequently Asked Questions
The current price of MTIE is 8.250 EGP — it has decreased by −0.48% in the past 24 hours. Watch MM GROUP FOR INDUSTRY AND INTERNATIONAL TRADE stock price performance more closely on the chart.
Depending on the exchange, the stock ticker may vary. For instance, on EGX exchange MM GROUP FOR INDUSTRY AND INTERNATIONAL TRADE stocks are traded under the ticker MTIE.
MTIE stock has fallen by −1.79% compared to the previous week, the month change is a 2.10% rise, over the last year MM GROUP FOR INDUSTRY AND INTERNATIONAL TRADE has showed a 16.79% increase.
MTIE reached its all-time high on Jul 13, 2025 with the price of 9.030 EGP, and its all-time low was 1.184 EGP and was reached on Jul 5, 2022. View more price dynamics on MTIE chart.
See other stocks reaching their highest and lowest prices.
See other stocks reaching their highest and lowest prices.
MTIE stock is 1.58% volatile and has beta coefficient of 1.39. Track MM GROUP FOR INDUSTRY AND INTERNATIONAL TRADE stock price on the chart and check out the list of the most volatile stocks — is MM GROUP FOR INDUSTRY AND INTERNATIONAL TRADE there?
Today MM GROUP FOR INDUSTRY AND INTERNATIONAL TRADE has the market capitalization of 12.46 B, it has decreased by −3.91% over the last week.
Yes, you can track MM GROUP FOR INDUSTRY AND INTERNATIONAL TRADE financials in yearly and quarterly reports right on TradingView.
MM GROUP FOR INDUSTRY AND INTERNATIONAL TRADE is going to release the next earnings report on Sep 3, 2025. Keep track of upcoming events with our Earnings Calendar.
MTIE net income for the last quarter is 240.32 M EGP, while the quarter before that showed 232.89 M EGP of net income which accounts for 3.19% change. Track more MM GROUP FOR INDUSTRY AND INTERNATIONAL TRADE financial stats to get the full picture.
No, MTIE doesn't pay any dividends to its shareholders. But don't worry, we've prepared a list of high-dividend stocks for you.
EBITDA measures a company's operating performance, its growth signifies an improvement in the efficiency of a company. MM GROUP FOR INDUSTRY AND INTERNATIONAL TRADE EBITDA is 1.26 B EGP, and current EBITDA margin is 8.03%. See more stats in MM GROUP FOR INDUSTRY AND INTERNATIONAL TRADE financial statements.
Like other stocks, MTIE shares are traded on stock exchanges, e.g. Nasdaq, Nyse, Euronext, and the easiest way to buy them is through an online stock broker. To do this, you need to open an account and follow a broker's procedures, then start trading. You can trade MM GROUP FOR INDUSTRY AND INTERNATIONAL TRADE stock right from TradingView charts — choose your broker and connect to your account.
Investing in stocks requires a comprehensive research: you should carefully study all the available data, e.g. company's financials, related news, and its technical analysis. So MM GROUP FOR INDUSTRY AND INTERNATIONAL TRADE technincal analysis shows the sell today, and its 1 week rating is buy. Since market conditions are prone to changes, it's worth looking a bit further into the future — according to the 1 month rating MM GROUP FOR INDUSTRY AND INTERNATIONAL TRADE stock shows the strong buy signal. See more of MM GROUP FOR INDUSTRY AND INTERNATIONAL TRADE technicals for a more comprehensive analysis.
If you're still not sure, try looking for inspiration in our curated watchlists.
If you're still not sure, try looking for inspiration in our curated watchlists.