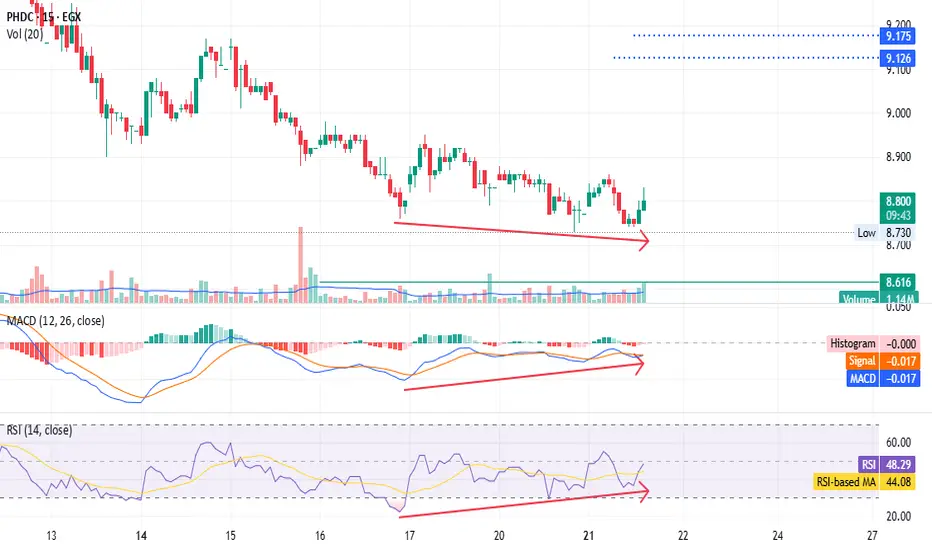
PHDC - don't give them away for free - only for shareholders EGX:PHDC - 15m timeframe
Hold your shares; don't give them away for free.
MACD and RSI show positive divergences.
Set a stop loss at 8.74.
Targets: 9.14 and 9.50.
*Not investment advice—just my chart analysis. Consult your account manager before investing. Good luck.*
PHDC trade ideas
PHDC Loading for a Massive Breakout – Hidden Bull Flag Inside!Palm Hills (PHDC) is gearing up for a powerful move! 📈
After months of respecting a clean ascending channel, price just bounced perfectly off lower support.
📊 Indicators flashing green:
StochRSI bullish cross ✅
MACD turning positive ✅
Squeeze Momentum showing early pressure build-up ✅
I’m buying between 6.70–6.85 EGP with a tight stop at 6.50 EGP.
🎯 Targets:
TP1: 7.50 EGP
TP2: 8.00–8.20 EGP
A clean breakout above 7.00 EGP could trigger explosive upside. Watch closely! 🚀
(DYOR – Not financial advice)

PHDC Short LOL, have you heard about the latest offers from Palm Hills Developments? They’ve launched a massive advertising campaign, offering apartments and villas with only a 1–3% down payment for properties that usually cost anywhere between 7 and 19 million EGP. Then, they’re allowing customers to pay very low monthly installments over 10 to 12 years. And guess what? This offer is only valid for 30 days.
Doesn’t seem logical, right?
Guess what else is happening in 39 days? The company’s earnings report—LOL. This is how such companies and “whales” manipulate the market.
According to the chart, the stock is extremely overbought, and it also appears that investors are unwilling to pay higher prices. The company notices this decline in investor interest and, anticipating a negative earnings report, they try to boost their earnings (to produce a higher-than-expected report) so investor interest spikes back up and the stock price doesn’t start trending down.
Spotting this sort of market manipulation should raise all sorts of red flags, which strengthens my idea of shorting this stock.
When it comes to technical analysis, the stock is overbought, and I think there’s a good chance for a correction. I would also expect other market participants to notice the manipulation and potentially short the stock as well.
If the first trendline breaks, wait for a retracement, then make an entry and set TP (take profit) at TP1. Move your stop-loss to breakeven. If it breaks the second trendline, then target TP2 and close the trade if the price reaches TP2.

PHDC : Entry pint 5.17 EGP, targeting 7.00 EGP the price will drug back to the secondary trend at price 5.17 EGP, then it will hit the ceiling price at 7.00 EGP and breaks it to new top.

PHDC to target 4.33 after crossing 3.52Monthly chart,
PHDC targets 4.33 after crossing the resistance line at 3.52
A very long term target is 9.35 after crossing the 5.0 resistance (high of April 2018)
Stop loss 2.8 should be considered

PHDC outlook 10-7-24Daily Analysis of PHDC based on Ichimoku, Law of diminshing returns, FIB EXT, BB, and others

Chart Victory: Bulls Charge as Heikin Ashi Signals Potential TK Chart Victory: Bulls Charge as Heikin Ashi Signals Potential TK Cross - A Win Like Mo Salah's Championship Goal!
Despite a positive outlook being challenged by the Kumo at 3.77, PHDC is on the verge of a bullish TK cross. Buyers showed tremendous interest at 3.73, evidenced by enormous volume in the last 15 minutes before the auction, which culminated in a supersonic finish. It's reminiscent of Hakeem Olajuwon and Michael Jordan slam dunking in the NBA championship. HOOOOORRRAy!

Advanced Trading Strategies Using Multiple IndicatorsTechnical Analysis Report: Advanced Trading Strategies Using Multiple Indicators
Introduction:
In this educational video, a comprehensive approach to technical analysis is presented, focusing on the identification of trend reversals and entry points in the market. The strategy incorporates a diverse set of indicators and concepts to enhance trading precision and decision-making.
Key Components:
1. Indicators Utilized:
- Fibonacci Retracement (Fibonacci)
- Average True Range (ATR)
- Cumulative Volume Delta
- Smart Money Concepts
- Relative Strength Index (RSI)
- Trailing Stop Loss ATR
- Ichimoku Kinko Hyo (Ichimoku)
2. Objective:
The primary goal of the strategy is to pinpoint the transition from a downtrend to an uptrend, facilitating well-timed trading decisions. By combining various technical tools, traders aim to increase the probability of successful trades.
3. Trading Philosophy:
- The emphasis on Ichimoku Kinko Hyo as a foundational element underscores the strategy's commitment to deriving signals from this powerful indicator.
- The reference to being an "Ichimokian" reflects a dedication to mastering Ichimoku strategies and principles in trading practices.
Conclusion:
By integrating a spectrum of indicators such as Fibonacci, ATR, volume analysis, RSI, and Ichimoku, traders following this methodology can gain a more holistic view of market dynamics. The utilization of these tools in conjunction with each other enhances the ability to identify optimal entry and exit points, laying a strong foundation for informed and strategic trading decisions.
This video encapsulates the essence of the educational content, offering insights into the advanced technical analysis approach advocated by the "ICHIMOKUontheNILE" community.


NEXT MARKET MOVE UP TO 2023NEXT MARKET MOVE UP TO 2023
At the bold black line, a major area,
At the orange line, a sub area
WE CAN UPDATE AFTER BROKEN

PALM HILLS 4/27 TO 28/4 The last day of Thursday in the stock market. Please sell today, it will be blood red.
EGX:EGX30


Palm Hills accumulation phasePHDC start final accumulation phase
It is expected to hit the bottom of the collection region starting from 1.22 L.E before start bullish phase towards 2.3 L.E in the medium term


PHDC Harmonic and IchimokuPHDC is forming Gartely harmonic pattern with positive signal from Ichimoku
