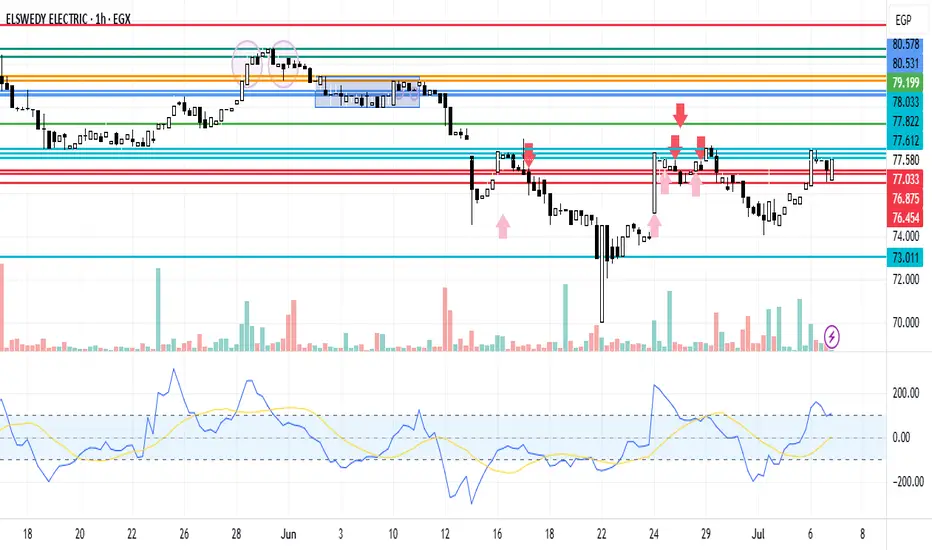
SWDY Neutral ZoneSWDY stock is in a neutral zone. In case of increasing, it's expected to breach the resistance line 77.612, 77.822 to reach 78.033. In case of decreasing, it's expected to break the support line 77.033, 76.875 to reach 76.454
SWDY trade ideas
SWDY Decrease AnalysisSWDY stock is in a decreasing zone. It reached the lowest support line at 73.011. In case of rebounding up which is highly expected, it'll reach the resistance line 75.011 to reach the 75.215 then the 3rd at 75.338

SWDY Neutral Zone AnalysisSWDY stock is in a neutral zone. There is a semi double bottom at the support line 80.742 that might encourage a bullish reversal pattern. In case of increasing it's expected to breach the resistance line 81.139 to reach the 81.209 then the 3rd at 81.420. In case of being a fake sign it'll break the support line at 80.742 to reach the 2nd at 80.578 then the 3rd at 80.531 points.

SWDY Double Bottom AnalysisSWDY stock has rebounded back from the resistance line of 81.97, to reach the support line at 81.163. It shows that the double bottom wasn't a true sign to encourage a bullish reversal pattern.

SWDY's New Upward Region Waiting for Chart Pattern ConfirmationSWDY stock is still trying to peak up, but unfortunately, it's rebounding back from the resistance line of 82.662. It had already broken the support line 81.970. In case of continuing, it'll break the support line 81.849 till reaching the support line 81.759. In case of rising, it'll breach the 1st resistance line to the 2nd resistance line at 82.933 points and the 3rd resistance line at 83.097. In general, it's expected to rise, especially for the presence of a double bottom, which will lead to a bullish reversal pattern and orient a new upward region, but the chart pattern confirmation is still in progress.

SWDY Future ReboundSWDY stock is trying to peak up, but unfortunately, it's rebounding back from the resistance line 80.081. It had already broken the support line 78.989. In case of continuing, it'll break the support line 78.928 till reaching the support line 78.868. In case of rising, it'll breach the 1st resistance line at 79.199, the 2nd resistance line at 79.320, and the 3rd resistance line at 79.470, which is more recommended due to its Q1 Profit Rise, which achieved EGP 4.15 Billion versus EGP 3.98 Billion a year ago beside its Q1 revenue EGP 59.39 Billion versus EGP 45.25 Billion a year ago.

SWDY Rebound AnalysisSWDY stock is trying to peak up, but unfortunately, it's rebounding back from the resistance line 80.081. In case of falling, it'll break the 1st support line 79.982 till reaching the 2nd support line 79.922, then the 3rd support line 79.832. In case of rising, it'll breach the 1st resistance line at 80.193, the 2nd resistance line at 80.344, and the 3rd resistance line at 80.464, which is more recommended due to its latest collaboration with Modon Holding to build an industrial zone for Egypt's Ras El Hekma on 10 Million square meters.

SWDY Trend Line AnalysisSWDY stock is in a downward line, but rebounded back from the support line 78.025. In case of falling it's expected to break the 1st support line 78.025 till reaching the 2nd support line 76.249. In case of rising, it's expected to breach the 1st resistance line 78.326, the 2nd resistance line 78.687, and the 3rd resistance line at 78.928, which is fundamentally highly expected due to its latest acquisition.

SWDY Trend AnaylsisSWDY stock is in a downward trend. In case of falling, it's expected to break the first support line at 78.025 points, till it reaches the second support line at 76.249 points. In case of rising, it's expected to reach the first support line 78.687, the second support line 78.928, and the third support line at 79.019, which is highly anticipated due to its latest acquisition.

Defining SWDY's TrendSWDY stock in the short run is still defining its trend. The most recommended case is rising, it's expected to reach the 1st resistance line 80.081, then the 2nd resistance line 80.183, and the 3rd resistance line 80.448 points. In case of falling, it's expected to reach the 1st support line 79.89, the 2nd support line 79.51, and the 3rd support line at 79.001, which is fundamentally not highly expected due to its latest acquisition.

SWDY Chart AnalysisEl Sewedy Electric stock trend rose last period from the support line 76.249 to the resistance line 83.77, then rebounded to reach the support line 79.001, so the general trend was down by 1.04%. The stock rose and broke the first support line at 78.287, to get the second support line at 78.389, then the third support line at 78.650. On the other hand, when the stock rebounded, it broke the first resistance line at 83.505 to reach the second resistance line at 83.097, then the third resistance line at 82.914. This upward trend is due to the acquisition of the majority of the stake in Thomassen Service, which is 60%. This step unlocks expansion into Europe, the Middle East, and Africa.

El Sewedy Electric Stock Trend AnalysisEl Sewedy Electric stock trend rose last period from the support line 78.287 to the resistance line 88.149, then rebounded to reach the support line 78.65, so the general trend was down by 0.24%. The stock rose, and broke the first support line 78.65 to reach the second support line 78.7574, then the third support line 78.858. On the other hand, when the stock rebounded, it broke the first resistance line 88.045 to reach the second resistance line 86.073, then the third resistance line 85.554

SWDY longIt seems that the pattern just keeps repeating itself with this stock. Just HH and HL.
I have pointed out entries and exits for the two types of traders. Just for the aggressive entries, make sure you put 50% of your stake now and maybe 50% after it breaks the trendline.
Should play out good, unless something in the market changes drastically.
The stoploss is a little wide since i believe whales knows what are our next move, and they for sure would love to shake us out of the market before they hit this stock much higher.
so STICK TO THIS STOPLOSS IF YOU ARE TO TAKE THIS TRADE, and dont be greedy.

SWDYanalysis performed using the following strategies and indicators:
Ichimoku Kinko Hyo
Law of diminishing returns
Volume price trend
Relative Strength Index (RSI)
Average True Range (ATR)
Linear Regression

How to confirm Buy/Sell recommendations?As a trader, I meticulously review recommendations from brokerage firms regarding potential stock purchases daily. Despite this, I am frequently confronted with the challenge of accurately predicting profit probabilities, as well as determining precise entry, exit, and stop-loss points.
My preference for the Ichimoku strategy means I conduct extensive analyses on my portfolio, a process that, while thorough, is also notably time-consuming. Moreover, in the midst of trading, I find myself eager to predict the characteristics of the forthcoming bar. To address these challenges, I integrate a variety of indicators into my strategy, including VWAP, Stochastic RSI, MACD, OBV, RedK Everex, SVP, and, crucially, volume analysis. Yet, even with these tools, predicting the next price level—as a target price within my Ichimoku trading framework—remains elusive.
In my quest for a more comprehensive understanding, I discovered a user-friendly and exceptionally effective indicator that enhances my VWAP framework: the BREAKOUT PROBABILITY (EXPO) by ZEIIRMAN. It offers a nuanced perspective that could markedly improve trade decision-making.
I highly recommend watching the educational video provided by ZEIIRMAN. It has the potential to add significant value to your portfolio.
Best of luck in your trading endeavors.
Mohamed Mahmoud

Multi timeframe analysis weekly to 5 minutesMulti timeframe analysis weekly to 5 minutes
Analysis is based on Ichimoku, and Elliot waves. Confirmation is done by other indicators such as MACD, stochastic RSI, OBV, and RedK Everex.
Watch the video idea to have the full picture of the stock under analysis.
watch the video for more details
Disclaimer:
The Content is for informational purposes only, you should not construe any such information or other material as legal, tax, investment, financial, or other advice.
There are risks associated with investing in stocks, and might involve risk of loss. Loss of principal is possible. Investors should note that past performance is not a guarantee of future returns. The investment value may be affected by market fluctuations.
The stocks mentioned here are not equivalent to, nor should it be treated as a substitute for, time deposit or any other form of saving deposits.
Investment in the securities of smaller companies can involve greater risk than is generally associated with investment in larger, more established companies that can result in significant capital losses.

Dancing on thin-iceThin-Ice due to Thick Red Kumo Ahead
Torc strength (buyers purchasing power) is Key success factor
watch video for more details

SWDY is still a starStock analysis based on Ichimoku & other indicators.
watch the video idea to find out about the details.
The narrative is Arabic.
The innuendo lies in COMI who vacuumed all liquidity today

Swdy Jinny Gann Fanz/LevelsJinny Gann Fan Levels are on the Chart possible Trendlines my WAY.
Jinny Gann Fan/Horizontal Lines Works as Support / Resistance.
Important levels for the Big 2 Cycles on the chart.
Trade Wisely.
Wish You Best of LUCK.

SWDY should target 39 after breakoutDaily chart, the stock is trying to beat a tough (cluster) resistance zone. Crossing this zone, and closing 2 days above 32.5 will activate the target 39.0
Resistance cluster zone: Resistance line R1 (blue) + Long term RL (dashed green)
Stop loss to be considered below S1 line.

trendless minor correction in the short-term
still positive outlook .. mid-term & long-term uptrending
can increase position size by buying @FVG levels.

ElSwedy Electric (SWDY) should target 38 then 50 and 55Daily chart, the stock is trading in a rising widening wedge, and has a tendency to cross the long term Resistance line (RL) at around 32.7, then the target will be 38.
Above the resistance line R1, the target will be 50 - (then 55 on the weekly time-frame)

swdy until jun2024This my idea for swdy journey in first half of 2024.
This is for long term invisting.
For short term venture this could be inaccurate.
