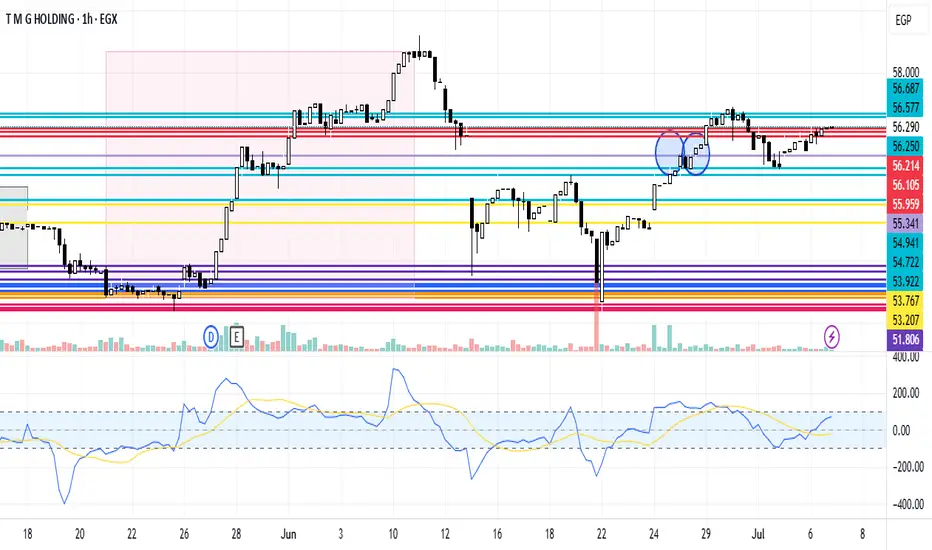
TMGH Neutral ZoneTMG Holding trend is in a neutral wave. In case of increasing it's expected to breach the resistance line 56.250, 56.577 to reach 56.687. In case of decreasing, it's expected to break the support line 56.214, 56.105 to reach 55.959
Next report date
—
Report period
—
EPS estimate
—
Revenue estimate
—
4.687 EGP
9.64 B EGP
43.49 B EGP
727.88 M
About T M G HOLDING
Sector
Industry
CEO
Hisham Talaat Mostafa
Website
Headquarters
Giza
Founded
2007
ISIN
EGS691S1C011
FIGI
BBG000DL6Q22
Talaat Moustafa Group Holding engages in investment activities. It invests, establishes, and participates in companies within different business sectors, such as real estate, hotels and hospitality, construction, and housing. The company was founded by Tarek Talaat Moustafa on February 13, 2007 and is headquartered in Giza, Egypt.
Related stocks
TMGH Chart AnalysisTMG Holding trend has unfortunately reached a lower region than before. Despite its continuous projects' updates, it reached the mentioned support line 51.233, if it continued decreasing it might reach the support line 51.142 then 51. On the other side, this decrease isn't expected to be long. It is

TMGH Rebound AnalysisTMG Holding trend is reaching a new peak zone at the resistance line 58.624. Historically, it is expected to rebound to the support line at 58.538, then the support line 58.452 and finally 56.734. In conclusion, it increased by 0.17%.

TMG Long UpdateHey everyone,
The chart shows bullish flag and held strong support at 47-48 price level. One thing that worries me is the liquidity below 47.5 (in green circle), because the price always makes big moves after a liquidity sweep, which in this case didn't happen yet.
So i expect one of two scenari

TMGH's New PeakTMG Holding trend is reaching a new peak zone at the resistance line 56.884. Historically, it is expected to rebound to the support line at 56.324, then the support line 55.2 and finally 55.165. In conclusion, it increased by 0.09%.

TMGH's Current Peak ZoneTMG Holding trend has reached its peak zone at the resistance line 55.661. Historically, it is expected to rebound to the support line at 55.2, then the support line at 54.987 and 54.916. In conclusion, it increased by 0.09% due to TMGH signing a memorandum of understanding to develop a new large-sc

TMGH Rebound ExpctationTMG Holding trend has reached its downward zone at the support line 51.142. In case of a rise, it is expected to breach the resistance line 51.233 and reach the resistance line at 51.625 points, then reach the third resistance line at 51.777 points. This upward direction is expected due to TMGH sign

TMGH in a Lower RegionTMG Holding trend has reached its downward zone at the support line 50.779, but rebounded. In case of a rise, it is expected to breach the resistance line 51.021 and reach the resistance line at 51.142 points, then reach the third resistance line at 51.233 points. In case of falling, it's expected t

TMGH Trend Line Rebound AnalysisTMG Holding trend is still in a downward zone, but rebounded at the support line 52.019. In case of a rise, it is expected to breach the resistance line 52.472 and reach the resistance line at 52.805 points. In case of falling, it's expected to break the 1st support line at 51.535 points, then the s

TMGH Trend Analysis TMG Holding trend is still in its neutral zone, reflecting bearish dominance over the bullish. In case of rising, it's expected to reach the resistance line 53.198, the second resistance line 53.228, then the third at 53.47 points. In case of falling, it is expected to reach the support line 52.956,

See all ideas
Summarizing what the indicators are suggesting.
Neutral
SellBuy
Strong sellStrong buy
Strong sellSellNeutralBuyStrong buy
Neutral
SellBuy
Strong sellStrong buy
Strong sellSellNeutralBuyStrong buy
Neutral
SellBuy
Strong sellStrong buy
Strong sellSellNeutralBuyStrong buy
An aggregate view of professional's ratings.
Neutral
SellBuy
Strong sellStrong buy
Strong sellSellNeutralBuyStrong buy
Neutral
SellBuy
Strong sellStrong buy
Strong sellSellNeutralBuyStrong buy
Neutral
SellBuy
Strong sellStrong buy
Strong sellSellNeutralBuyStrong buy
Displays a symbol's price movements over previous years to identify recurring trends.
Curated watchlists where TMGH is featured.

Frequently Asked Questions
The current price of TMGH is 53.300 EGP — it has increased by 1.47% in the past 24 hours. Watch T M G HOLDING stock price performance more closely on the chart.
Depending on the exchange, the stock ticker may vary. For instance, on EGX exchange T M G HOLDING stocks are traded under the ticker TMGH.
TMGH stock has fallen by −1.70% compared to the previous week, the month change is a −4.05% fall, over the last year T M G HOLDING has showed a −4.87% decrease.
We've gathered analysts' opinions on T M G HOLDING future price: according to them, TMGH price has a max estimate of 120.00 EGP and a min estimate of 120.00 EGP. Watch TMGH chart and read a more detailed T M G HOLDING stock forecast: see what analysts think of T M G HOLDING and suggest that you do with its stocks.
TMGH reached its all-time high on Mar 5, 2024 with the price of 91.400 EGP, and its all-time low was 2.273 EGP and was reached on Feb 24, 2009. View more price dynamics on TMGH chart.
See other stocks reaching their highest and lowest prices.
See other stocks reaching their highest and lowest prices.
TMGH stock is 1.47% volatile and has beta coefficient of 1.05. Track T M G HOLDING stock price on the chart and check out the list of the most volatile stocks — is T M G HOLDING there?
Today T M G HOLDING has the market capitalization of 109.83 B, it has decreased by −3.32% over the last week.
Yes, you can track T M G HOLDING financials in yearly and quarterly reports right on TradingView.
T M G HOLDING is going to release the next earnings report on Sep 3, 2025. Keep track of upcoming events with our Earnings Calendar.
TMGH net income for the last quarter is 3.99 B EGP, while the quarter before that showed 2.12 B EGP of net income which accounts for 88.30% change. Track more T M G HOLDING financial stats to get the full picture.
T M G HOLDING dividend yield was 0.45% in 2024, and payout ratio reached 5.35%. The year before the numbers were 0.92% and 15.09% correspondingly. See high-dividend stocks and find more opportunities for your portfolio.
EBITDA measures a company's operating performance, its growth signifies an improvement in the efficiency of a company. T M G HOLDING EBITDA is 12.00 B EGP, and current EBITDA margin is 29.32%. See more stats in T M G HOLDING financial statements.
Like other stocks, TMGH shares are traded on stock exchanges, e.g. Nasdaq, Nyse, Euronext, and the easiest way to buy them is through an online stock broker. To do this, you need to open an account and follow a broker's procedures, then start trading. You can trade T M G HOLDING stock right from TradingView charts — choose your broker and connect to your account.
Investing in stocks requires a comprehensive research: you should carefully study all the available data, e.g. company's financials, related news, and its technical analysis. So T M G HOLDING technincal analysis shows the sell today, and its 1 week rating is neutral. Since market conditions are prone to changes, it's worth looking a bit further into the future — according to the 1 month rating T M G HOLDING stock shows the neutral signal. See more of T M G HOLDING technicals for a more comprehensive analysis.
If you're still not sure, try looking for inspiration in our curated watchlists.
If you're still not sure, try looking for inspiration in our curated watchlists.