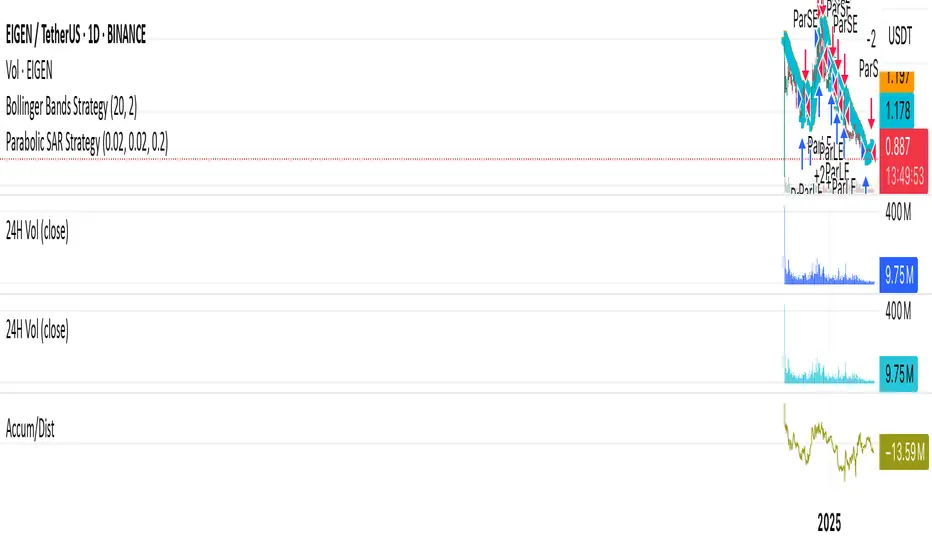
EIGEN/USDT — Ready to Explode from Accumulation?🔍 Detailed Technical Analysis (1D Timeframe):
After months of bearish pressure, $EIGEN is now showing early signs of a trend reversal. The chart is painting a compelling picture of a breakout setup backed by a strong accumulation base and a long-term descending trendline.
🟨 Solid Accumulation Zone:
Price has been consolidating tightly within the $0.90 – $1.10 range, forming a clear accumulation zone. This zone has acted as a reliable support area multiple times, rejecting bearish attempts and indicating smart money accumulation.
This type of sideways base is often the foundation for explosive upside moves.
📉 Descending Trendline Breakout Setup:
A clear descending resistance line has been holding since the highs in December 2024.
Price is now approaching a critical breakout point. A confirmed breakout above this trendline could mark the beginning of a new bullish trend.
📈 Bullish Scenario (Momentum Breakout):
If price breaks out above the descending trendline and clears the key resistance at $1.227, the path toward higher targets opens up quickly:
Bullish Target Levels Description
🎯 $1.603 Minor psychological resistance
🎯 $1.980 Structural resistance
🎯 $2.341 Fibonacci confluence & supply zone
🎯 $2.982 Medium-term target
🎯 $3.993 Breakout continuation level
🎯 $5.480 – $5.659 Previous all-time high (ATH) region
📌 Note: For a valid breakout, look for a strong daily candle close above $1.227, ideally with high volume to confirm momentum.
🔻 Bearish Scenario (Rejection Play):
If price gets rejected at the trendline and fails to break $1.227:
A pullback to the $1.00 – $0.90 accumulation zone is likely.
If that support fails, price may drop toward:
🔻 $0.85
🔻 $0.78
🔻 $0.68 (key psychological & historical volume zone)
📊 Conclusion: Make or Break Moment Ahead
EIGEN is at a critical decision point. A successful breakout could kick off a major bullish phase, while a failure may extend the sideways or bearish action.
With a strong base formed and pressure building near the trendline, this setup deserves a spot on every trader’s radar.
#EIGENUSDT #CryptoBreakout #AltcoinSetup #TechnicalAnalysis #BullishScenario #BearishScenario #AccumulationZone #PriceAction #CryptoTrading #CryptoAnalysis
EIGENUSDT trade ideas

EigenFor me looks really nice on 4h and smaller TF.
Close above FVG would be confirmation for me, in trade allready though

EIGEN Eyes Key Demand — Watching $1 for a Potential BounceScenario 1 (Reversal from Demand):
Wait for lower timeframe (M15/H1) reversal signal in $0.98–$1.16 zone
If confirmed, consider long entries with tight risk below $0.98
First target: $1.40–$1.55 (local supply); next: $2.15
Scenario 2 (Breakdown):
If price loses $0.98 with no reaction, step aside — next strong support much lower
No interest in longs if green zone fails

EIGEN/USDT – Falling Wedge Breakout Setup | 4H ChartEIGEN is currently showing a bullish falling wedge pattern near a strong horizontal demand zone, indicating a potential reversal move.
Technical Breakdown:
Entry Zone: $1.17 – $1.18 (current market price)
Stop-Loss: Below $1.14 (last wick low/invalidation of wedge)
Target Price: $1.74, $2.51 (+118%) from CMP
Resistance 1 (Minor): $1.33
Resistance 2 (Major Target): $1.74
Support Levels:
• $1.17 (Immediate support)
• $0.749 (Major demand zone if breakdown)
Target & Risk-Reward
Target Price: $1.74, $2.51 (+118%) from CMP
Stop-Loss: $1.14
Risk per token: ~$0.03
Potential Profit per token: ~$0.56
Risk:Reward Ratio: ~1:6.5
Potential Gain: +118% from entry
Indicators:
Falling wedge breakout looks imminent
RSI (14) at 39.5 — recovering from oversold zone
Demand zone previously triggered rallies — the probability of a bounce is high
Strategy:
Wait for a 4H candle close above the wedge trendline + volume confirmation to validate the breakout. Scaling in near support with a tight stop-loss can offer a strong risk-reward play.
Not Financial Advice – This is a technical view for educational purposes. Always DYOR & manage risk accordingly.
Like & follow if you found this useful!
#EIGEN #Altcoins #Breakout

Eigenlayer EIGEN price analysisLooking at the OKX:EIGENUSDT chart, we can see that the growth amplitude is “choking” and trading volumes are decreasing.
Therefore, at the current price, we would not risk buying #EIGEN
But at $0.90, it's safer! Or at $1.80-1.90, but only after the price breaks through and consolidates above the trend line.
#Eigenlayer is based on the #Ethereum ecosystem and has “come alive” following the price of CRYPTOCAP:ETH
_____________________
Did you like our analysis? Leave a comment, like, and follow to get more

$EIGEN/USDT Trade SetupPrice broke above key resistance and is now retesting the zone.
- Entry: CMP
- Stop Loss: $1.5972
- Targets: $2.0211 / $2.2899
Holding the trendline demand flip strong bullish bias.
Breakout traders, keep it on your radar.
DYRO, NFA

#EIGENUSDT ( flag )Maybe the yellow flag pattern could have been imagined for him.
We are monitoring the crossing above the yellow flag 👀

EIGEN – Chasing Strength Over PerfectionDoubt I’ll see BINANCE:EIGENUSDT back below $1—so here’s my take:
Risk/reward isn’t ideal at this level, but there’s a clear chance of continuation, and this isn’t one I want to miss.
Buying a small bag now, with plans to add in the green zone if it dips. While a revisit to the Monthly Open is unlikely, that area could be tested if the market cools off.
Leaning more toward higher prices than a retrace—for now.

EigenLayer (EIGEN) – Overview and Technical Analysis
🔎 What is EigenLayer ?
EigenLayer is a restaking protocol built on Ethereum that aims to enhance network security and scalability by allowing validators to reuse their staked ETH or other liquid staking tokens (LSTs) to secure additional decentralized applications (dApps) and services.
This innovative approach provides a way for Ethereum's existing security to be "recycled", making it easier for new projects to launch with a high level of security without building their own validator networks.
Key Features :
Restaking : Allows ETH stakers to earn additional yield by securing multiple services.
Security Scaling : Strengthens the overall security of Ethereum's ecosystem by reusing existing validator resources.
Flexible Staking : Supports a wide range of tokens and assets, increasing the capital efficiency of the Ethereum network.
📈 Technical Analysis (4H Chart)
Looking at the 4H chart, we can see a classic bullish structure forming :
Strong Bounce from Bull OTE – The recent rally came after a clear divergence and a tap into the Bull OTE, suggesting a high-confidence reversal.
Next Key Levels – Immediate resistance sits around $1.40 (local swing high), with the next major level around $2.20 and potentially $3.40 if the momentum continues.
Support to Watch – The Bull OTE and FVG 1D around $0.90 - $1.05 should act as a solid support zone if the market pulls back.
📊 Short-Term Outlook
With this kind of momentum, the short-term outlook for EIGEN remains bullish, but a healthy retracement to the $1.00 - $1.10 area could provide a solid reloading zone before the next leg up.

EigenLayer Easy Targets, Broken Downtrend —500%Now we are looking at EigenLayer, a new project.
Notice the very strong downtrend that started in mid-December 2024. It is hard to believe that it has been already more than five months.
Notice this huge downtrend and how EIGENUSDT broke out without breaking bullish. This is ok if you are looking for good options to buy and trade.
This pair trades at a low price, early, and has huge potential for growth in weeks, months and days.
I will give you some targets, the bottom is in. But a full blown bullish confirmation happens when the action moves above 'main resistance'. The action is happening now within a strong buy-zone.
This zone is the last chance and opportunity to buy when prices are low. It will start growing next and this growth will go for months.
The first target can hit short-term while the second is set for the mid-term. Long-term, you can expect even more.
A perfect strategy for spot traders is simply to buy and hold. When prices are high, say 200%-300%, collect profits and move on to the next trade.
Repeat this process over and over, again and again, and watch your portfolio grow faster than the bull market.
Buy ten pairs and each time one matures, sell and find one trading near support and repeat the process. This is a simple strategy but it pays.
If you miss the selling point, wait.
Never buy when prices are high.
Never sell when prices are low.
Do it the other way around... Buy now, sell later when the masses start to buy at the top. When they are buying, you are selling.
Now that everybody is selling, you have to buy, buy everything up.
Namaste.

EIGENUSDTMy expectation is to powerfull explode to high. EIGEN is so strong and it target to min 1:2 risk ratio. lets wait and see

EIGENUSDT 1D AnalysisEIGEN ~ 1D Analysis
#EIGEN Buy after successfully penetrating this resistant line with a short -term target of at least 10%+.

their original 32$32.45M is worth only $10.03M (-69%)Remember that whale (or institution) who made a big move buying EIGEN last year? They’re not doing so well 😂
They started with 32.45MinUSDC,bought8.917MEIGEN at an average price of 3$3.64, and lost 17.19M.ThentheyswitchedpartoftheirpositiontoHYPE at the peak, only to lose another $5.21M. Now, after just 5 months, their original 32$32.45M is worth only $10.03M (-69%).
Ouch! 🐬
Trade $EIGEN , come to Gate – no need to think of reasons, just a pure recommendation! 😄
EIGEN/USDTEIGEN/USDT Analysis
Time frame (1D)
Buy Setup:
Entry Zone: $1.08 - $1.14 (strong support area & Fibonacci 0.382).
Target Levels:
TP1: $1.94 (Fibonacci 1.618).
TP2: $2.27 (Fibonacci 2.272).
TP3: $3.61 (Fibonacci 3.618).
Stop Loss: Below $0.95 (support breakdown).
Key Insights:
1. Price continues to respect the ascending trendline, confirming bullish momentum.
2. Pullback to Fibonacci 0.382 signals a potential buying opportunity.
3. Additional confirmation: Monitor for increased volume during a breakout of minor resistance.

$EIGEN 4HTF🚀 $EIGEN Analysis
📊 4H Timeframe:
🔺 Ascending Triangle Formation – Price consolidating within structure.
📍 Resistance: $1.20 - $1.23
📍 Support: $1.08 - $1.12
📊 Daily Timeframe:
📉 Descending Parallel Channel – Price moving under trendline resistance.
📍 Key Resistance: $1.30
👀 Breakout or Rejection? Watch key levels for confirmation!

EIGENUSDT 1DEIGEN ~ 1D Analysis
#EIGEN If you expect this coin to be bullish again, You have to wait until this resistant line is successfully penetrated.
Bullish will not return before this resistance succeeds in broken.

#EIGEN/USDT#EIGEN
The price is moving in a descending channel on the 1-hour frame and is adhering to it well and is heading to break it strongly upwards and retest it
We have a bounce from the lower limit of the descending channel, this support is at a price of 1.56
We have a downtrend on the RSI indicator that is about to break and retest, which supports the rise
We have a trend to stabilize above the moving average 100
Entry price 1.71
First target 1.83
Second target 1.90
Third target 1.98

EIGEN / USDT : Retesting the Trendline after breakout EIGEN/USDT: Retesting the Trendline After Breakout
EIGEN/USDT is showing promising signs 📈 as it retests the trendline after a breakout 📊. This retest is crucial as it could confirm the trendline as a new support zone, setting the stage for a strong bullish continuation 💥. If the support holds, we could see a significant upward move 🚀. Keep a close watch 👀 on this pair and wait for confirmation before taking action.
Key insights:
1. Trendline retest: EIGEN/USDT is retesting the trendline it recently broke above. Successfully flipping this resistance into support could confirm the breakout and trigger a bullish rally.
2. Volume validation: Monitor trading volume closely. A surge in volume during the retest would confirm strong buyer interest 🔥.
3. Bullish signals: Momentum indicators such as RSI and MACD are showing positive trends ⚡, supporting the likelihood of a bullish continuation.
Steps to confirm the trendline support:
Look for a clear 4H or daily candle closing above the retested trendline 📍.
A noticeable increase in volume during the retest can signal strong buying activity 📊.
If the trendline holds as support, it adds credibility to the bullish continuation ✅.
Be cautious of false signals, such as sharp pullbacks or wicks below the trendline ⚠️.
Risk management strategies:
Use stop-loss orders to manage your risk effectively 🔒.
Ensure position sizing aligns with your overall trading strategy 🎯.
This analysis is for educational purposes only and not financial advice. Always conduct your own research (DYOR) 🔍 before making investment decisions.

EIGENUSDT 1WEIGEN ~ 1W Analysis
#EIGEN Selling pressure seems to have begun to weaken from here. Buy from here if you still have a Conviction on this coin with a minimum target of 20%+.

$EIGEN - I am seeing some huge potential here.BINANCE:EIGENUSDT - I am seeing some huge potential here, despite the negative bias in the market. I see some minor retracement pending before a huge run up. I'd get ready to pull my socks up for this guy.

Eigen is one of the projects on my radar.This is my game plan. Bottoms are buying opportunities for me.
* What i share here is not an investment advice. Please do your own research before investing in any digital asset.
* Never take my personal opinions as investment advice, you may lose all your money.

EIGEN - Falling Wedge BreakoutA descending falling wedge has formed on the 4h chart for BINANCE:EIGENUSDT that we have broken out of as of this morning.
A lot of the ALT crypto space is looking like falling wedges with breakouts, or about to breakout.
EIGEN on the move.

#EIGEN/USDT Update📈 #EIGEN/USDT Update 📈
$EIGEN has broken the Diagonal Trendline in the 4-Hour timeframe.
🔄 Plan: Wait for a successful retest before entering a long position.
📌 Resistance: PDH $2.8187
