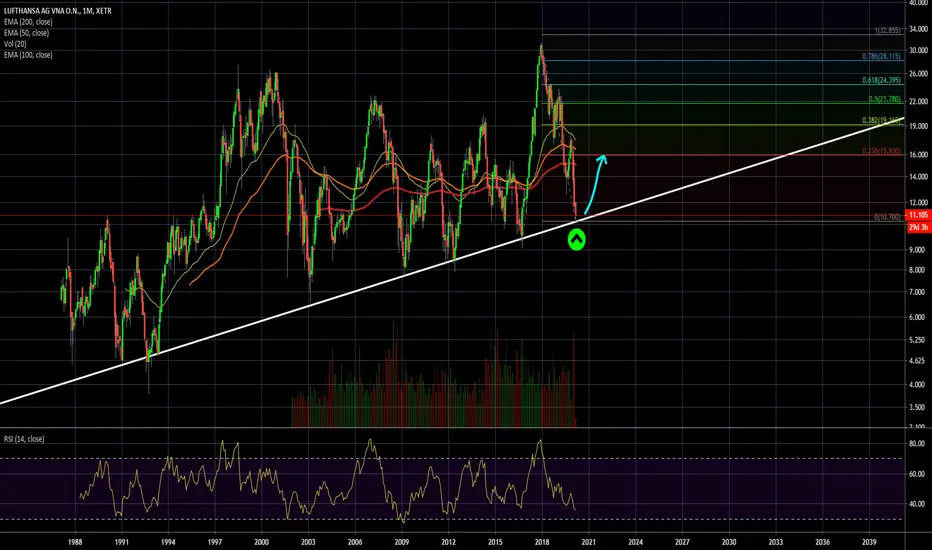
Lufthansa - Dangerous TimesMonthly Trendline lost... Furthermore, the daily chart has hit the lost trendline zone as resistance and was heavily rejected.
Corona heavily hitting Lufthansa... Good luck with that chart...
Happy Trading!
LHA trade ideas


Lufthansa AGLufthansa Historical Chart.
Disclaimer:
We are not registered or licensed in any jurisdiction whatsoever to provide investing advice or anything of an advisory or consultancy nature,
and are therefore are unqualified to give investment recommendations.
Always do your own research and consult with a licensed investment professional before investing.
This communication is never to be used as the basis of making investment decisions, and it is for entertainment purposes only.

Lufthansa Long TermLet’s have a look at on LHA chart on very long time frame from 1988 until now
What we can see here is a picture of constant extreme volatily
Historically it seems like prices below 18€ were okay entry points while when the price was above 20€ it mostly always was a good time to take profits or go short
Risk-neutral, anti-cyciclal investors with patience ( at least 1 year ) can buy the stock here with a target of 18€
The draw blue line should offer strong multi year support and a stop loss can be set below at around 9€
tl,dr short-term mildly bearish or neutral, mid or long term mildly bullish

Lufthansa | ready to take off!The stock is heavily oversold due to the corona crisis. Sooner or later it should start to trend up again. Currently the price is in a favorable region, where it might be good to buy in cheap!
LHA - DAILY CHARTHi, today we are going to talk about LHA
We observe a D1, some important points. The details are highlighted above.
Thank you for reading and leave your comments if you like.
Join the Traders Heaven today, for more exclusive contents!
Link bellow!
Disclaimer: All content of Golden Dragon has only educational and informational purposes, and never should use it as financial advice

Lufthansa ready to fly to higher altitudesOof, I will just be honest here, chances like this you won't find often. Longing this like there is no tomorrow.
- Kumo break with some cooldown
- Clear bull div on the renko chart (pretty big brick size)
- 3 bricks printed = my confirmation to go in this case.
- OBV seems to have bottomed out nicely.
Target: 20% longerterm.

LHA time to buy right now!?I think think this is nice time to buy and hold. This is long term trade, not short one. Black ones are levels for those who are looking for some shorter trades ( you can DM me for more)
My play is Buy with R/R 3:7

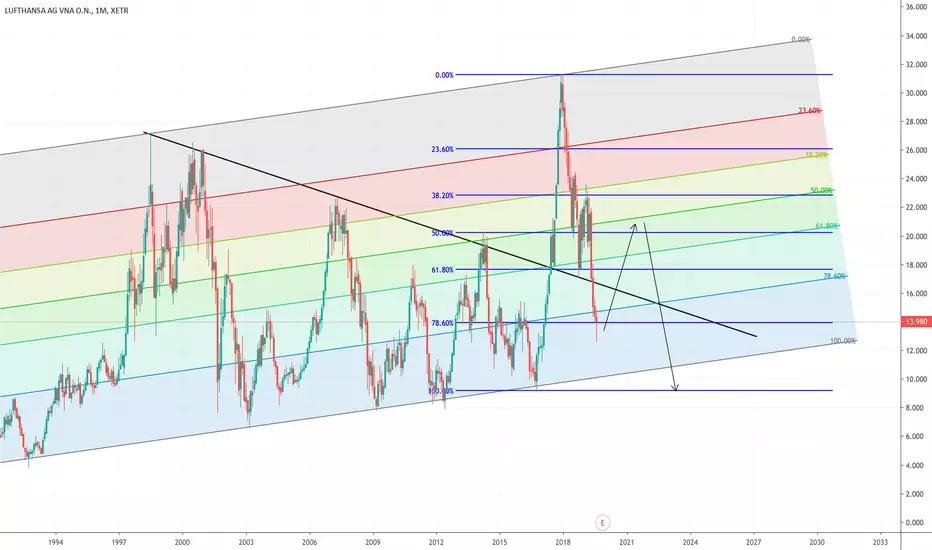
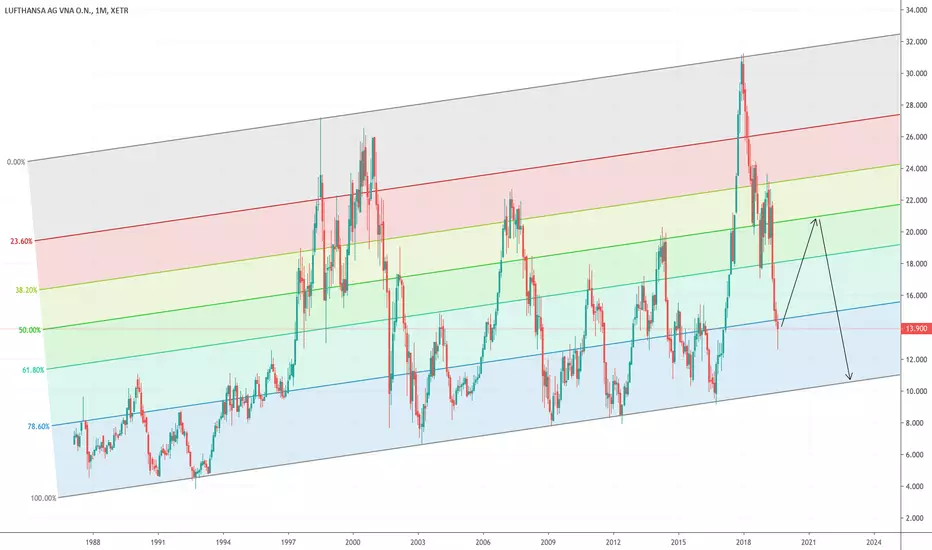
LHA, Lufthansa Note the square, Fibonacci 0.78 reman as strong support. Black lines are multi-year significant levels and will be crucial for my next trade. According to RSI, we can see some future drop coming in.
That is the case if values continue to move in 45-25 range.
After all, the dividend is OK, so some long is not so bad to have.


Lufthansa vor Gegenbewegung?Ab überschreiten der Marke von 18 Euro im Tagesschlusskurs sehe ich die Aktie der Lufthansa bullisch mind. bis zur Schliessung der Kurslücke.


Lufthansa Long rallyLufthansa is leaving the downward trend and can develop upwards. Importantly, there will be more expensive ticket prices from the next few years and that can have a positive as well as a negative impact on prices.

LHA Risky Long tradeI will enter at 17.6€ today. Even though it is pretty risky... Strong downtrend...

Is it a five wave structure?Looking at LHA 45 min time frame I think I can see a clear 5 wave structure. The problem is that the fifth wave is slightly larger than the third wave right now, making it the shortest. Does this small change matters, or can accept?


LHA Breakout or bearish flag??Hard to say if LHA already reached it's target. I think OIL prices will go up...

LHA LufthansaLufthansa is just sitting at a support but I think it will break it and bounce from the 17.7€ level...
