NASDAQ Potential UpsidesHey Traders, in today's trading session we are monitoring NAS100 for a buying opportunity around 22,380 zone, NASDAQ is trading in an uptrend and currently is in a correction phase in which it is approaching the trend at 22,380 support and resistance area.
Trade safe, Joe.
NDQ100 trade ideas

Nasdaq look out for weekly sellwe have look into all the tim frames all we see is sells happening next week
there was a trend going up since last week but this week we looking for sells stay turned

Fractal, 3 steps down then upFractal is based on the whole move of 2024 -2025 flipped and mirrored, seems to be quite accurate. Buying back in when under the recent base. This drop will be quick and hard.
Not trading advice

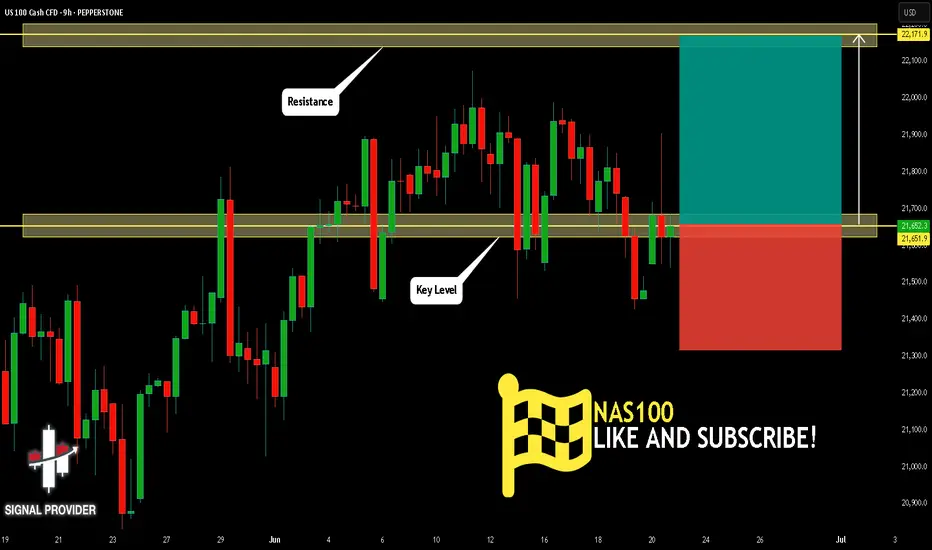
NAS100 Will Go Up From Support! Buy!
Please, check our technical outlook for NAS100.
Time Frame: 9h
Current Trend: Bullish
Sentiment: Oversold (based on 7-period RSI)
Forecast: Bullish
The market is approaching a key horizontal level 21,651.9.
Considering the today's price action, probabilities will be high to see a movement to 22,171.9.
P.S
We determine oversold/overbought condition with RSI indicator.
When it drops below 30 - the market is considered to be oversold.
When it bounces above 70 - the market is considered to be overbought.
Disclosure: I am part of Trade Nation's Influencer program and receive a monthly fee for using their TradingView charts in my analysis.
Like and subscribe and comment my ideas if you enjoy them!
WRONG!, THIS IS A BAD IDEA, SHORT INDEXESYa know... as the title says. It's wrong, nothing about this idea is sensical... but that's where it just might pay off. Non-sense. One special person to take the bull by the horns and say "I want in at better prices"...
This is not trading advice nor a valid idea, nothin says the chart will reverse... being early and being right eventually doesn't usually pay... but watch for signs... they may come.

NASDAQ| - Continuation Setup Fueled by Momentum📌 Pair: NAS100 (NASDAQ)
📈 Bias: Bullish
🕰 HTF View (4H):
Strong bullish momentum unfolding with structure showing clear intent to continue higher. No major signs of reversal—smart money appears to be driving price up.
🧭 MTF View (30M → 2H clarity):
Using the 2H for cleaner narrative. Waiting for a clean sweep of sell-side liquidity (SSL) into a refined OB to continue the move. 30M showing structural alignment with the bullish bias.
🎯 Entry Criteria:
LTF CHoCH → Liquidity sweep → OB mitigation
Confirm the shift and execute on the return.
🎯 Target: Structure highs above
🧠 Mindset Note:
Momentum is your ally—but don’t let speed replace structure. Follow your confirmation sequence, stay surgical, and let price do the work.
Bless Trading!

"NASDAQ 100: THE TECH ROBBERY! – Quick Profits Before Reversal?"🔥 "The NDX NASDAQ 100 INDEX Heist: Bullish Loot & Escape Before the Trap!" 🔥
🌟 Hi! Hola! Ola! Bonjour! Hallo! Marhaba! 🌟
Dear Money Makers & Market Robbers, 🤑💰💸✈️
Based on the 🔥Thief Trading Style🔥 (technical + fundamental analysis), here’s our master plan to heist the NDX - NASDAQ 100 INDEX. Follow the strategy on the chart—long entry is the play! Aim to escape near the high-risk RED Zone (overbought, consolidation, potential reversal). The bears are lurking, so take profits and treat yourself—you’ve earned it! 💪🏆🎉
🚀Entry (The Vault is Open!)
"Swipe the bullish loot at any price!"
For precision, place buy limit orders within 15-30min timeframe (recent swing lows/highs).
Set alerts! Don’t miss the heist.
🛑 Stop Loss (Safety Net)
Thief-style SL at nearest swing low (4H timeframe) → 21,000.00 (adjust based on risk/lot size).
🏴☠️ Target 🎯: 22,800.00
Bullish momentum is fueling this heist—ride the wave but exit before the trap!
📰 Fundamental Backing (Why This Heist Works)
Macroeconomic trends, COT data, geopolitics, and sentiment align for bullish moves.
Full analysis? Check our bio0 linkk! 👉🔗🌎
⚠️ Trading Alerts (News & Risk Mgmt)
Avoid new trades during high-impact news (volatility = danger).
Use trailing stops to lock profits and dodge sudden reversals.
💥 Boost This Heist!
Hit 👍 (Boost Button) to strengthen our robbery squad!
More heists = More profits—stay tuned for the next steal! 🚀🤑
See you soon, fellow thieves! 🤝🎉

NASDAQ: Short-lived pullback ahead of major breakout.Nasdaq has entered strong bullish territory on its 1D technical outlook (RSI = 66.290, MACD = 331.080, ADX = 18.600). Despite that, it remains inside a slow moving Channel Up for the past month in contrast to the more aggressive bullish waves of the Channel Up in April and May. The 4H RSI peak may be similar to May 12th and April 24th. We believe that at least a +9.69% rally will emerge to approach the top of this 3 month Channel Up. Stay bullish, TP = 23,400.
## If you like our free content follow our profile to get more daily ideas. ##
## Comments and likes are greatly appreciated. ##

USNAS100 Hits New ATH | Watch 22,520 for Possible Correction USNAS100 TECHNICAL OVERVIEW
Nasdaq 100 Prints New ATH | Eyeing 22,640, But Correction Risk Builds
USNAS100 recorded a new all-time high, supported by broad bullish sentiment across U.S. indices after upbeat S&P and inflation data boosted risk appetite.
Technically, the index remains bullish, but signs of short-term exhaustion are appearing.
If the price closes below 22,520 on the 1H timeframe, a correction toward the 22,280 zone is likely.
However, a clean break above 22,640 would confirm continuation toward the next upside target at 22,790.
Key Levels
Pivot Line: 22,520
Resistance: 22,640 → 22,790
Support: 22,410 → 22,280 → 22,200
Take a look at the previous idea to see more reality...

Nasdaq - Will market discount from ResistanceNasdaq had a heavy plunge and pull. As per my projection, the stocks like apple, amazon, google, meta, nvidia heavily affects its price. The chart pattern shows strong resistance at 22.5K Price. Will market discount 20% this Fall 2025.
Lets watch ahead to know.

Smart Friday Trades: NASDAQ Setup and Key Levels to Watch NAS100📊 NASDAQ US100 Analysis – Friday Setup
I'm currently watching the NASDAQ closely 👀. The NAS100 looks significantly overextended 📈, and with it being the end of the week, we often see price action push into the weekly high before pulling back into the weekly close 🔁.
This is a pattern I’ve seen play out many times during the New York session on Fridays 🗽📉.
💡 Here’s my suggestion:
Wait for today’s data release 📅 to finish. If price ranges and then breaks market structure to the downside, keep an eye out for a short entry on the retrace and retest of the range low.
🎯 Your targets and stop loss are outlined clearly in the video, so make sure to watch it through.
⚠️ Trade sensibly, manage your risk, and don't rush into anything.
I'd love to hear your thoughts in the comments 💬
Have an awesome day and I’ll see you in the next one! 🚀

Tomorrow marks start of downtrend?NASDAQ just swept all-time highs into a key diagonal trendline drawn from previous major swing highs. We’re now in the premium zone of a macro fib retracement, and Asian session is showing signs of accumulation around 22,460.
Expecting London session to run Asian highs, tapping 22,500, which lines up perfectly with:
✅ Major rising trendline resistance
✅ 0.0 fib (ATH)
✅ Asian liquidity sweep
✅ High probability "Manipulation" phase of AMD (Accumulation–Manipulation–Distribution)
Looking to short at 22,500 with a tight SL at 22,520–22,530, targeting a full swing retrace into 20,500.
Confluences:
Bearish AMD setup across sessions
Major trendline rejection zone
Premium fib zone (swing retracement logic)
Liquidity sitting below multiple structural lows
Risk-to-reward of 1:100 potential if held to target
Waiting for confirmation via lower timeframe BOS after the sweep. If 22,500 holds as resistance post-sweep, this could be the beginning of a broader correction.
Let’s see how it plays out. 🔥


US100 (NASDAQ 100 Index) – Breakout with Clear Upside ProjectionUS100 has broken out cleanly above the key resistance at 22,097.1, indicating bullish continuation. The breakout is supported by strong upward momentum, targeting the next key level around 23,441.9, as illustrated by the projected range.
Support at: 22,097.1 🔽 | 20,750.0 🔽
Resistance at: 23,441.9 🔼
🔎 Bias:
🔼 Bullish: Sustained price action above 22,097.1 keeps the bullish breakout valid, aiming toward 23,441.9.
🔽 Bearish: A drop back below 22,097.1 would invalidate the breakout, possibly pulling price toward 20,750.0.
📛 Disclaimer: This is not financial advice. Trade at your own risk.

USNAS100 Eyes New ATH as Fed Rate Cut Bets &Ceasefire Fuel Rally USNAS100 OVERVIEW
Wall Street Gains as Rate Cut Hopes and Ceasefire Boost Sentiment
U.S. indices surged on Monday as growing expectations for a potential Federal Reserve rate cut in July helped offset market concerns over Middle East tensions.
The ceasefire agreement between Israel and Iran further eased geopolitical risk, supporting bullish momentum on Wall Street.
Forward Outlook:
A combination of dovish monetary policy expectations and geopolitical de-escalation continues to support upside potential in U.S. equities.
TECHNICAL OUTLOOK – (USNAS100)
The price has stabilized above 22,090, signaling strength and opening the path toward a new All-Time High (ATH) and beyond.
As long as the price holds above 22,090, the bullish trend remains in control.
A break and stabilization below 22,090 would suggest a bearish correction may be underway.
Resistance Levels: 22,210 → 22,280 → 22,460
Support Levels: 21,930 → 21,850

NAS100 Breakout – Eyeing Bullish Extensions or False Break?The NAS100 (US100) is in full breakout mode on the daily, surging past previous highs near 22,140 with strong momentum. Price is now trading at ~22,550, decisively above prior resistance, which could now act as support if we retest.
🔎 Multi-Timeframe Breakdown:
✅ Daily Chart:
• Massive bullish structure intact.
• Clean breakout above horizontal resistance at 22,140.
• Price riding an aggressive ascending trendline — watching for sustained closes above breakout level.
✅ 4H Chart:
• Higher lows and bullish impulsive candles confirm buyers in control.
• Multiple support zones below (22,300, 22,100) for potential retests.
• Key short-term resistance formed near 22,650 — a rejection here could trigger correction.
✅ 1H & 23m Charts:
• Micro pullback seen after tagging fresh highs; price still holding above short-term trendlines.
• Consolidation zone between 22,500–22,600 could be decisive for next move.
⸻
📌 Key Zones to Watch:
• Support: 22,300 / 22,140
• Resistance: 22,650 / 22,800
• A breakout retest could confirm continuation; otherwise, failure to hold support might signal a fakeout.
⸻
📈 Bias: Bullish (Long)
While momentum remains strong, be prepared for potential sharp corrections given overextension.
⸻
What do you think? Drop your thoughts below! 🚀👇

NSDQ100 Bullish breakout supported at 21950President Trump rejected a Pentagon intelligence report suggesting his airstrikes on Iran had limited effect, claiming they caused “total obliteration,” despite inconclusive satellite imagery. In a surprising move that weakens longstanding US sanctions, Trump also allowed China to resume purchases of Iranian oil.
Federal Reserve Chair Jerome Powell reiterated that the current inflation outlook supports holding interest rates steady. He is expected to provide further detail in testimony before the Senate Banking Committee today.
Markets responded calmly: stock futures were steady as the Israel-Iran truce held, and oil prices rose slightly after their sharpest two-day drop since 2022.
Separately, the UK announced plans to purchase 12 US-made F-35A fighter jets capable of carrying nuclear weapons, in a bid to strengthen ties with Trump. NATO allies are working diplomatically to reassure the US of their unity, ahead of a summit in The Hague.
Key Support and Resistance Levels
Resistance Level 1: 22380
Resistance Level 2: 22500
Resistance Level 3: 22690
Support Level 1: 21950
Support Level 2: 21810
Support Level 3: 21680
This communication is for informational purposes only and should not be viewed as any form of recommendation as to a particular course of action or as investment advice. It is not intended as an offer or solicitation for the purchase or sale of any financial instrument or as an official confirmation of any transaction. Opinions, estimates and assumptions expressed herein are made as of the date of this communication and are subject to change without notice. This communication has been prepared based upon information, including market prices, data and other information, believed to be reliable; however, Trade Nation does not warrant its completeness or accuracy. All market prices and market data contained in or attached to this communication are indicative and subject to change without notice.

US100 - The NasDAQ_26_06_2025📈 US100 Trade Breakdown – Liquidity Grab + Bullish Continuation Potential 🚀
Caption for TradingView:
"Liquidity above equal highs has been taken ("EQL TAKEN") — classic stop hunt setup. Price then respected a bullish order block, forming a clean ascending structure off the green demand zone. If price holds above the black trendline, I’m expecting a bullish continuation. Next move? Either a retest of demand at 22,240–22,250 or continuation toward 22,400. Watch for reaction around the demand zone — that’s the key to the next leg."
🔍 Key Zones:
EQL Taken: Liquidity sweep above highs — signs of smart money movement.
Demand Zone (Green Block): Price launchpad; strong reaction confirms buyer interest.
HUGE LEVEL: Marked as structural support; price may revisit on pullback.
📌 Analysis:
Market structure is bullish (higher highs, higher lows).
Liquidity above recent highs has been collected — possible fuel for a deeper move.
If price fails to hold above the trendline, look for a break and retest setup toward the lower green zone.

Nasdaq Surges on Ceasefire Hopes – New All-Time Highs Ahead?By analyzing the #Nasdaq chart on the weekly timeframe, we can see that the index experienced a strong rally following the ceasefire announcement between Iran and Israel, climbing as high as 22,200 so far. If the ceasefire holds and tensions continue to ease, we could see a new all-time high for the Nasdaq.
Potential bullish targets for this move are 22,400, 23,200, and 24,000.
Please support me with your likes and comments to motivate me to share more analysis with you and share your opinion about the possible trend of this chart with me !
Best Regards , Arman Shaban

NAS SETUPNas 100 setup using smart money concepts. A change in the state of price delivery has occured at level 22,518.48 then we wait for entry cnfirmation when price either touch the bearish order lock at level 22,519.23 or when it comes back to the fair value gap to rebalance price at level 22,560.67 ....hence we are shorting the market when our rules are met

NAS100 – Short from Premium Post-ATH Liquidity Sweep (27-06-25)
Buyside liquidity swept at 22,554.05 after fresh ATHs. Short triggered on a strong bearish news candle from premium territory. TP set at 22,423.99 near a Bright Gold HeatMap cluster. SL at 22,585.01 above structural highs. Trade thesis driven by Box Theory, liquidity targeting, and expected short-term correction from overextended highs.

US Tech 100 CFD broke the Resistance level 22,365.0 range👀Possible scenario:
U.S. stock futures climbed on June 27, with the S\&P 500 and Nasdaq nearing record highs as investors awaited May’s PCE inflation report — the Fed’s preferred gauge — due at 8:30 a.m. ET.
Rate cut expectations grew following reports that President Trump may replace Fed Chair Powell by fall. The odds of a July rate cut rose to 20.7%, up from 14.5% last week. Soft GDP growth, rising jobless claims, and a rare earth trade agreement with China added to the dovish outlook. Also due June 27 final June consumer sentiment data and remarks from several Fed officials.
✅Support and Resistance Levels
Support level is now located at 21,360.0
Now, the resistance level is located at 22,570.0

NASDAQ, USTECUSTEC price is currently near the main resistance level of 22168-22229. If the price cannot break through the level of 22229, it is expected that the price will have a chance to go down. Consider selling the red zone.
🔥Trading futures, forex, CFDs and stocks carries a risk of loss.
Please consider carefully whether such trading is suitable for you.
>>GooD Luck 😊
❤️ Like and subscribe to never miss a new idea!
