US100 Update This is a 45-minute chart of the US 100 (NASDAQ Index) from CAPITAL.COM, and it presents a bullish continuation scenario.
---
Key Highlights:
Current Price: 22,254.6
Change: +72.7 points (+0.33%)
---
Chart Structure:
Support Zone (Lower Blue Box): ~21,950–22,050
Resistance Zone (Upper Blue Box): ~22,400–22,500
Dotted Path Projection: Suggests the following potential move:
1. Climb toward the upper resistance zone
2. Brief pullback
3. Continuation breakout above 22,500 to around 22,600
---
Interpretation:
Current Trend: Bullish, with a strong series of higher lows and gradual build-up
Market Bias: Expecting continuation of the uptrend as long as price holds above 22,050
Potential Trade Idea:
Buy on Dip: Near 22,100–22,150 zone (if a pullback happens)
Target: 22,500–22,600
Stop-Loss: Below 22,000
---
Summary:
Trend: Bullish
Setup Type: Breakout Continuation
Watch for: Consolidation near 22,400 before a push higher
Would you like me to compile trade parameters (entry, stop, target) for all three setups (Gold, BTC, NASDAQ) in one place?
NDQ100 trade ideas

Nasdaq 100 Near Breakout – Eyes on 22,200 ResistanceThe Nasdaq 100 is approaching a critical technical level at 22,200. This resistance marks the upper boundary of recent consolidation and aligns with prior rejection zones. A clean break above this threshold could trigger a sharp upside move, possibly propelling the index into uncharted territory.
Geopolitical tensions have eased, and the dollar’s renewed weakness is supporting risk appetite, particularly in the tech-heavy Nasdaq. Strong earnings from key sectors are reinforcing bullish sentiment, with investors increasingly pricing in a favorable macro backdrop.
Technically, momentum is building. Price action has formed a series of higher lows, and buying pressure is intensifying near resistance. A breakout above 22,200 could ignite a strong rally, driven by stop orders and fresh bullish entries.
That said, traders should remain cautious. While the breakout setup is promising, a retracement toward support zones—such as 21,500 or the 20-day moving average—remains possible, especially if upcoming inflation or macro data disappoints.
For now, the 22,200 level remains the key to watch. A daily close above this level would shift the bias clearly higher, confirming breakout strength and potentially accelerating gains toward 22,800 or beyond.

XAUUSD
🚨 Smart Money Sniper Signal – XAU/USD (Gold)
🕒 Timeframe: M15 or H1
📅 Date: June 25, 2025
---
🔍 Market Context
Current price: ~$3,326
Market structure: Bullish on H1
Liquidity grab zone: Observed around $3,322
Order block support: $3,318 – $3,322
RSI: Above 50 (bullish momentum)
---
🟢 Buy Setup (Sniper Entry)
Entry zone: $3,322 – $3,324 (on bullish confirmation)
Confirmation: Bullish engulfing or strong bullish candle on M15
Stop Loss: Below $3,318
Take Profit targets:
TP1: $3,330
TP2: $3,336
TP3: $3,344
🧠 Tip: Use a Risk:Reward ratio of at least 1:2. Set trailing stop once TP1 is reached.
---
🔴 Sell Scenario (If invalidation)
If price breaks below $3,318 with volume:
→ Wait for a retest of the zone and enter SELL
TP1: $3,312
TP2: $3,304
---
🔔 For TalionPromosal (TradingView page)
Use this caption for your idea post:
> 💥 Smart Money Signal (Gold – M15/H1)
Bullish structure still valid. Looking for sniper entry near $3,322 with OB + RSI confluence.
SL below $3,318. TP targets $3,330 / $3,336 / $3,344.
Risk-managed & institutionally aligned setup.
#SmartMoney #XAUUSD #Gold #SniperEntry #TalionPromosal #TradingView

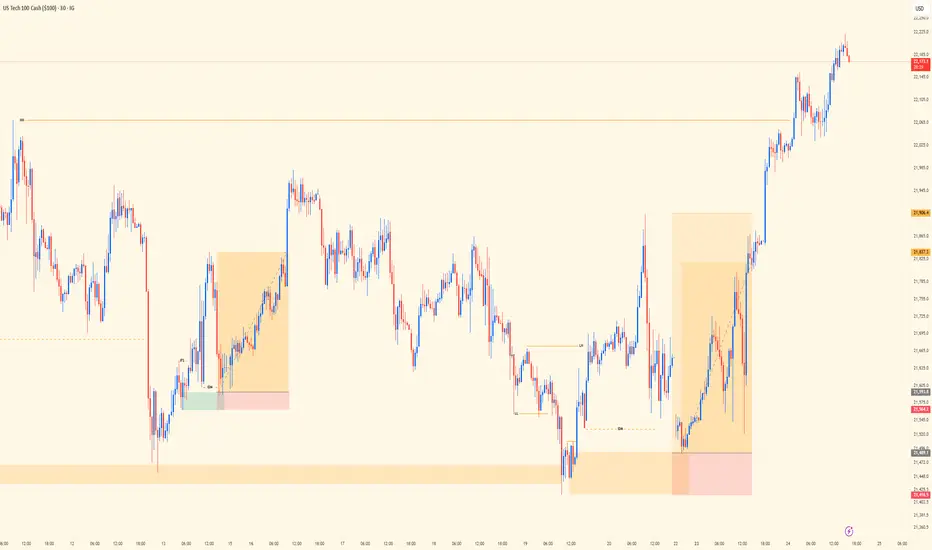
NASDAQ Midweek Review | Trend, Liquidity, PrecisionSingle-chart post today showing the execution trail behind two solid wins on NASDAQ.
Top-down bias was aligned — bulls clearly in control, so I stuck with trend direction. No need to fight momentum. As a trend trader, I don’t counter — that mindset shift alone is what keeps me consistent and clean with entries.
Chart shows the 30M view — where structure, liquidity, and timing came together. Both setups were built off elite structure reads. Liquidity played its part: manipulation, sweep, confirmation, and execution.
Bias: Bullish
HTF Alignment: Bullish trend continuation
Entry Frame: 30M precision
Key Insight: Liquidity isn’t noise — it’s narrative.
Mindset Note: Counter-trading is a shortcut to inconsistency. Stay with flow, respect structure.
Bless Trading!
Bullish IdeaExplained on graph. I justify the bull using OB and FVG and sweeps of Liquidity from London lows, if all aligns I will take this trade.

Buy NasAfter breaking the recent H4 resistance we hoping that Nas is reaching for the Daily higher high and probably breaking it.
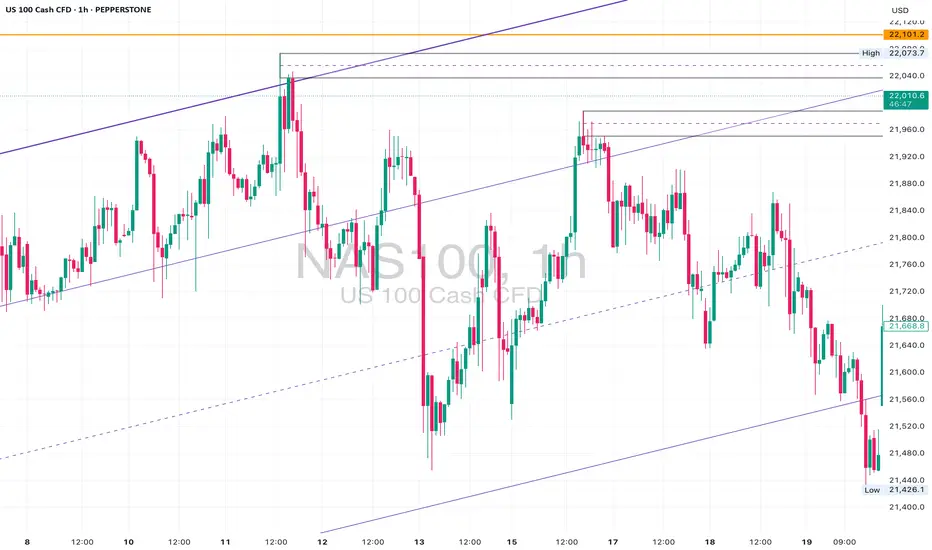
NAS100 Analysis – Structure Breakout or Trap?📍 Levels Marked: 22,101 Resistance | 21,880 Mid-Level | 21,375 Channel Support
⸻
📊 Technical Breakdown:
The NAS100 has surged into the 22,000+ range, breaking above the mid-level channel boundary after consolidating beneath it for days. This breakout takes us right back into an untested supply zone from March.
On the lower timeframes (1H & 23min), price cleanly cleared multiple lower highs with aggressive bullish momentum, printing a new intraday high at 22,015. However, structure is still trapped inside a long-term ascending channel on the 4H and D1 — and this move could be setting up a liquidity grab before reversal.
Key zone to watch:
• 22,101 – 22,200 (daily resistance + equal highs)
• 21,880 – 21,920 (possible retest zone)
• 21,375 (channel base support)
⸻
📉 Trade Ideas:
• Short Bias if price rejects the 22,100–22,200 area with bearish confirmation on lower timeframes. Target: 21,800 – 21,600.
• Long Bias only if price gives a bullish retest of the 21,880–21,920 zone with clean structure. Target: 22,222+ with tight risk.
⸻
💡 Final Thoughts:
A textbook case of a channel edge breakout — but breakout or fakeout? Always wait for confirmation and let structure guide the setup. We’re either about to print new highs or see a sharp correction.
📌 Mark your levels. Watch the retest. Execute with confidence.
US100 / NASDAQ TodayUS100 Today is still bearish
My SSM structure is still down
I'm waiting to open US and looking good entry

NASDAQ Will the 4H MA200 support the Channel Up?Nasdaq (NDX) has been trading within a Channel Up since mid-May and today almost touched the pattern's bottom, making a Higher Low. At the same time, the 4H MA200 (orange trend-line) is right below it, the medium-term's natural Support.
Since the 4H RSI also bounced on the 32.20 Support, which is where the pattern bottomed on May 23, we expect the new Bullish Leg to start, as long as of course the 4H MA200 holds. The Target is the 1.382 Fibonacci extension at 22300.
-------------------------------------------------------------------------------
** Please LIKE 👍, FOLLOW ✅, SHARE 🙌 and COMMENT ✍ if you enjoy this idea! Also share your ideas and charts in the comments section below! This is best way to keep it relevant, support us, keep the content here free and allow the idea to reach as many people as possible. **
-------------------------------------------------------------------------------
Disclosure: I am part of Trade Nation's Influencer program and receive a monthly fee for using their TradingView charts in my analysis.
💸💸💸💸💸💸
👇 👇 👇 👇 👇 👇

US 100 – Potential For Further Geo-Political Volatility AheadEarly trading this Monday morning has been dominated by President Trump's surprise weekend decision to launch airstrikes on three nuclear sites in Iran, which may increase the potential for a wider conflict in the Middle East.
After closing at 21,652 on Friday, this news led the US 100 to a gap open lower to 21,375 in early Asian trading, however, this drop didn't last long and the index has since recovered to trade back up to 21600 again at the time of writing (0800 BST).
Looking forward, the focus for traders may continue to be on Iran's next move. So far they have confined their retaliation to missile attacks on Israel, but they did issue a statement saying they reserve all options to defend themselves.
Fresh attacks on US bases in the region, or deciding to close the Strait of Hormuz, a vital shipping supply route for Oil and Gas from the region, may undermine risk sentiment which could lead to renewed selling of the US 100, while any options suggesting a potential quicker resolution to this conflict may be seized upon by traders to push the index back up to higher levels seen in the middle of last week.
There are scheduled events released across the week that may also be relevant, these include the testimony of Federal Reserve (Fed) Chairman Jerome Powell to congress at 1500 BST on Tuesday and Wednesday, as well as the next US PCE Index update at 1330 BST on Friday, which is the Fed's preferred inflation gauge.
Technical Update: Assessing Support and Resistance Levels
Escalation of hostilities in the middle east over the weekend may leave traders uncertain as to the direction of the next price activity for the US 100 moving forward.
However, technical analysis can help to outline potential support and resistance levels, which if broken to the up or downside, might offer clues on where the index may move.
Potential Support Levels:
Looking at the chart of the US 100 index below, it could be argued that Monday’s lower opening level has already tested what traders may be viewing as support at 21373. This level is equal to half the May 23rd to June 11th phase of price strength.
Having seen an initial recovery following tests of this 21373 level, it may now have been strengthened as a support focus. This means closing breaks below 21373, while not a guarantee of further price declines, may suggest tests of the next support at 20666, which is the May 23rd price low, even 20360, the 38% Fibonacci retracement level, could be possible.
Potential Resistance Levels:
In terms of resistance levels to monitor this week, as the chart shows, Friday’s activity did see a sell-off from its 21905 session high. This confirms sellers have been active at this level previously and may prove to be again.
As such, traders may now be watching the defence of this 21905 level on a closing basis, as breaks above this resistance may now be required to see attempts to push to higher levels which may include a challenge of resistance at 22074, the June 11th session upside extreme, possibly then 2226, the February 18th high.
The material provided here has not been prepared
accordance with legal requirements designed to promote the independence of investment research and as such is considered to be a marketing communication. Whilst it is not subject to any prohibition on dealing ahead of the dissemination of investment research, we will not seek to take any advantage before providing it to our clients.
Pepperstone doesn’t represent that the material provided here is accurate, current or complete, and therefore shouldn’t be relied upon as such. The information, whether from a third party or not, isn’t to be considered as a recommendation; or an offer to buy or sell; or the solicitation of an offer to buy or sell any security, financial product or instrument; or to participate in any particular trading strategy. It does not take into account readers’ financial situation or investment objectives. We advise any readers of this content to seek their own advice. Without the approval of Pepperstone, reproduction or redistribution of this information isn’t permitted.

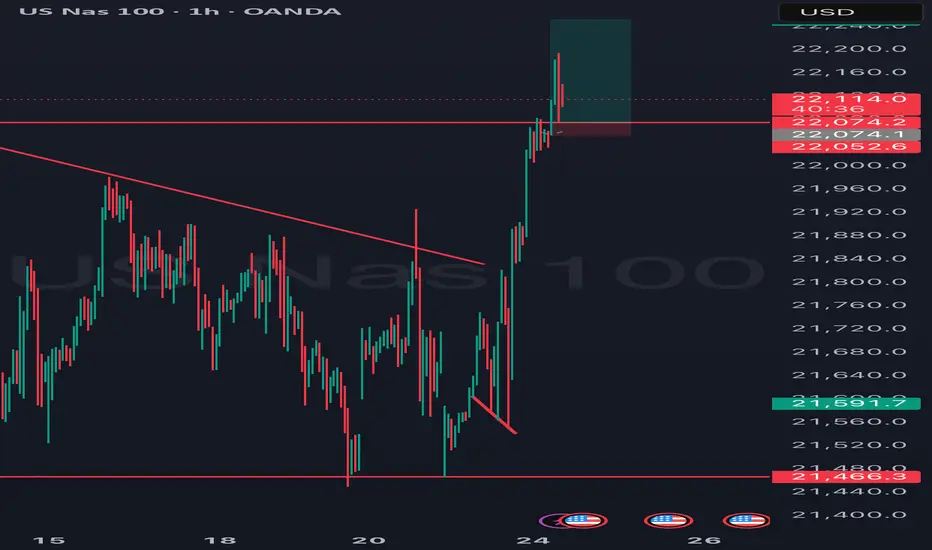
Bearish SentimentIf structure follows, I will be looking to take reversal post NY open and short this once Buy Side liquidity gets taken out.
TP's will target Liquidity from the London session lows.

Nas100/US100 Short Setup based on Fundamentals
Hello everyone. We have seen the Nasdaq form a new local top at the 22k area and is now heading back down.
There are many reasons why price is falling but remember this only a temporary sell off as the master trend on the highest time frame is up not down.
Today (Friday 20th June) is OPEX. $6.6 Trillion of options are set to expire today and the Max Pain level is 21,500. Price could drive there to render most options worthless.
Institutions and hedge funds have increasingly added short positions or are sitting on the side lines. Indicating lack of buying from the larger players for the time being.
Buying volume is lower than the selling volume at the top of this rally.
We have 2 weeks roughly until trump tarrifs are implemented and not many trade deals have been made.
Iran-Israel conflict with a possible US involvement.
FED is leaning towards a more hawkish approach due to tarrifs but says the US economy is still growing.
How I am looking at this for the near future. In the chart I have marked my entry, My SL, My Max TP and where I would take partials on the way down. I may also even scale in more if I see the opportunity.
Thanks for reading.

NAS100 | Intraday buy setupTimeframe: M15
🔸 Bias: Short-term bullish (scalp to premium zone)
Price just tapped into a fresh M15 demand zone following a strong impulsive leg and is now showing early signs of a reaction (entry model confirmation ✅). Liquidity has been taken beneath the short-term low, and I'm now looking for a short-term push back into the premium supply area near 21,800.
🧩 Confluences:
Bullish BOS + Demand zone reaction
Liquidity sweep below Asian session low
Entry model + candle shift on M15
Potential reversal from discount → premium
🎯 Target: 21,800 zone
❌ Invalidation: Clean break & hold below 21,675
⏳ Type: Intraday scalp / short-term swing
“Risk managed. Liquidity collected. Now we let price tell the rest of the story.” 🚀

NAS100 - Will the stock market continue to rise?!The index is trading in its short-term descending channel on the four-hour timeframe between EMA200 and EMA50. If there is no re-up and the channel is broken, I expect a correction to form, the target of which can be the bottom of the descending channel.
If the channel top is broken, we can expect a new ATH to be recorded in the Nasdaq index. It is better to wait for confirmation in case of a breakdown in order to control the risk further.
Over the past week, the Nasdaq has managed to stay within a stable range, especially despite geopolitical pressures, mixed signals from the Federal Reserve, and some concerns in the semiconductor sector. This stability is largely due to the strong fundamentals of large technology companies, the reduction in distribution days (selling pressure) in the market, and renewed expectations of interest rate cuts later in the year.
At a structural level, the number of distribution days, which indicate selling pressure from large institutions, has reached a relatively low number of 3 days in the Nasdaq over the past month. This is a sign of the weakness of heavy selling at price peaks and the market's willingness to maintain long positions. Unlike trends seen in previous years, this time the market has shown no signs of widespread divergence or fundamental weakness, even despite strong inflation data or concerns about new trade restrictions with China.
This trend is largely supported by the stellar performance of companies such as Nvidia, Microsoft, Apple and other major players in the artificial intelligence and technology sectors. Revenue growth, increased investment in AI infrastructure, as well as the return of institutional investors’ confidence in technology stocks, have led the Nasdaq to record significant returns since the beginning of 2025. Analysts from major financial institutions such as Goldman Sachs and Morgan Stanley, while warning of potential selling pressure on the index, remain positive about continued growth, of course, assuming that economic data does not deviate from the expected path.
However, some risks are clearly visible in the trading week ahead. The most important of them is the possibility of geopolitical tensions again affecting the market. In recent days, oil prices have risen and financial markets have experienced moments of fear after tensions in the Middle East escalated and the US political response to Iran and Israel's moves. Although the Nasdaq was able to withstand these fluctuations, the market remains very sensitive to energy price spikes and their impact on inflation.
Important data in the coming week could also determine the market's direction. The release of the Core PCE index, the Fed's preferred inflation measure, as well as data on unemployment insurance claims, both play a key role in the interest rate outlook. If inflation data is lower than expected, the likelihood that the Fed will start cutting rates in September or November increases, which would be a bullish stimulus for the stock market and especially the Nasdaq.
On the other hand, potential pressure on the semiconductor group - especially if new restrictions on technology exports to China are imposed - could disrupt the market trend. Last Friday, just one news report on the possibility of restricting exports of advanced chipsets caused the Nasdaq to fall by more than 0.6%. If this trend becomes official US government policy, it could cause a correction in stocks of companies such as Nvidia, AMD and ASML, which are heavy weights in the Nasdaq index.
In addition to these factors, next week will also see the release of quarterly reports from major companies such as Micron, FedEx and Nike. The results of these reports, especially in the area of sales and cost forecasts, could affect economic growth expectations. If the figures are better than expected, the Nasdaq could move towards new highs. However, if the data is released, the market could enter a short-term correction phase.
In terms of correlation with monetary policy, the Nasdaq index has become more sensitive than ever to interest rates and cash flows. The dollar price, real interest rates, and the direction of Treasury bonds all now have a direct impact on the valuation of technology companies. As a result, any change in the path of monetary tightening or easing is immediately reflected in the Nasdaq’s performance. However, analysts believe that the market will remain in a “wait and see” phase until the official data is released in July. In summary, the Nasdaq index is currently in a situation where its fundamentals are supported by the profitability of large technology companies, the easing of institutional selling pressure, and the possibility of a rate cut. At the same time, the market remains highly sensitive to major geopolitical news, trade policy, and economic data. As a result, the week ahead can be considered a “two-sided” period, where opportunities and threats are in a delicate balance, and only economic data and quarterly results can tip the balance in the direction of an increase or a correction.

Nasdaq continuation sellsH4: STILL BULLISH INTERNALLY WITH OUR LAST SIGNIFICANT HL AT 21000
-Possible major chOch on H4 is very possible due to the HTF major zone we at
-Wait for proper H1 & lower tineframe confirmations before jumping in any trades
H1: BEARISH MARKET STRUCTURE STARTING TO PLAY WITH LAST LH AT 21925
-Potential continuation of sells all the way down to take out H4 hl a 21000
-We recently broke below a buying range on H1 & created a selling range
-Possible pullback buys before sells within that range are imminent
M15: We have a nice supply+fvg for sells at 21835
-Wait for price to pullback in there then M1 chOch then attack

Triple Top Forming on NAS100? Reversal Attempt BrewingNAS100 may be carving out a triple top or micro head-and-shoulders, hinting at a potential short-term reversal. A confirmed break of the current range is still required to validate downside momentum. With heightened geopolitical risk (U.S. strike on Iran), capital may rotate into gold and oil, weighing on equities. This is a low-risk, short-term idea only—more structure and confirmation needed before hunting larger trend moves.

NASS1001. Nasdaq 100 (NASS100) Performance
As of mid-June 2025, the Nasdaq 100 index is around 21,600 to 21,700 points, showing moderate volatility with recent declines amid geopolitical tensions and trade concerns.
Technology stocks, including semiconductor giants like NVIDIA and Broadcom, remain influential on Nasdaq movements.
Market sentiment is cautious due to escalating Middle East conflicts and US-China trade uncertainties.
2. US 10-Year Treasury Yield (US10Y)
The US 10-year Treasury yield is hovering around 4.3% to 4.4% in June 2025.
Yields have edged up recently, reflecting inflation expectations and Federal Reserve monetary policy stance.
Rising yields often pressure growth stocks, including tech-heavy Nasdaq components, due to higher discount rates on future earnings.
3. US Dollar Index (DXY) Dynamics
The DXY has been relatively stable but showed some weakening in 2025 despite rising Treasury yields, reflecting complex market dynamics including geopolitical risks and shifts in capital flows.
A weaker dollar can support Nasdaq by boosting earnings of multinational tech firms through favorable currency translation, while a stronger dollar can weigh on exports and earnings.
4. Interplay Between NASS100, US10Y, and DXY
Rising US10Y yields tend to put downward pressure on Nasdaq 100 due to increased discount rates and borrowing costs for growth companies.
DXY movements influence Nasdaq via currency effects on multinational revenues and investor risk appetite.
Recent geopolitical tensions and trade uncertainties have increased market volatility, occasionally decoupling typical correlations.
Softer inflation and weak labor data have temporarily boosted investor sentiment, supporting modest Nasdaq gains despite yield pressures.
Conclusion
the Nasdaq 100 faces pressure from rising US 10-year Treasury yields, which increase discount rates on tech stocks, while geopolitical tensions and trade uncertainties add volatility. The US Dollar Index’s relative weakness provides some support to Nasdaq earnings, partially offsetting yield headwinds. Market participants remain cautious, balancing inflation data, Fed policy, and global risks in their outlook.
#NASS100

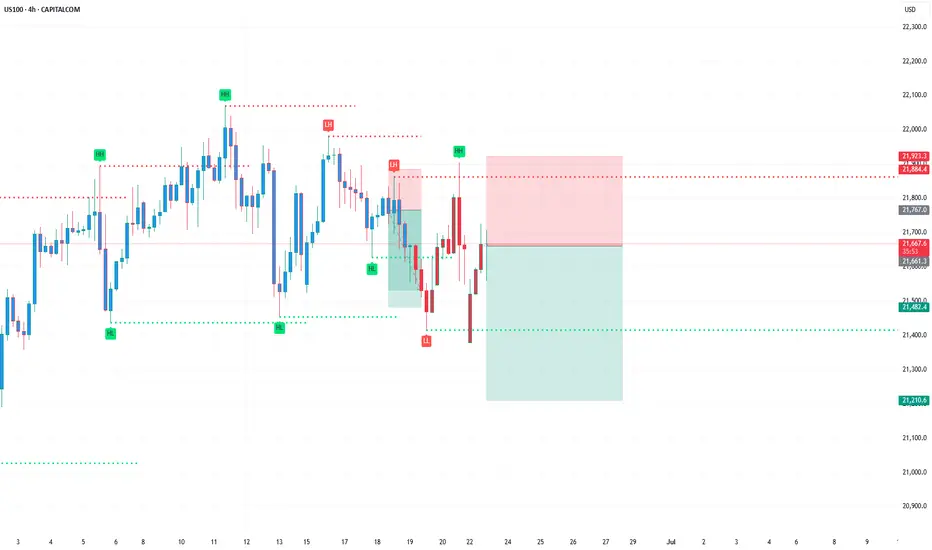
USTECH H4 AnalysisUSTECH Showing a bullish Flag. If it breaks this zone above, Most probably can fly up to 22,106.35 and higher TO 23,200. If no, Can rally between 20,800, 20,400 or even lower. Trading Analysis from 23-06-25 to 27-06-25. Take your risk under control and wait for market to break support or resistance on smaller time frame. Best of luck everyone and happy trading.🤗

Market Structure 1hr According to what's happening between Iran and Isreal and Trump has attacked Iran in my anticipation and what I do see in the marketplace honestly right now and how the markets has been moving its so terrible so being more careful is important but am anticipating lower prices in this market NAS100 Index, that's not calling it for anybody to short but that's what am thinking is going to happen, it's going to be a nice week ahead at Sunday opening and there we shall see where we want to roll to

NASDAQ100 SELL POTENTIAL!Looking at the market structure in US100 from the daily timeframe, we’re seeing a possible sell opportunity as price is beginning to form a distribution stage
Therefore, I anticipate a drop in price. A sell opportunity is envisaged

NASDAQ Short-Term Outlook (Study Purpose Only)The NASDAQ index is showing signs of short-term weakness following a rejection near the 22,000–22,200 resistance zone. The recent breakdown from the consolidation range suggests bearish sentiment is building.
🔻 Key Observations:
Stop Loss Zone: 22,192
Price should ideally remain below this level for a bearish setup to remain valid. A move above this zone may invalidate the downside scenario.
Immediate Support Level: 21,010
If selling pressure continues, this is the first potential bounce zone. Watch price behavior closely here.
Deeper Support Target: 20,223
A break below 21,000 could open the door for a drop toward the 20,200 area — a previous accumulation/support level.
⚠️ Risk Management:
Traders may consider this type of setup if looking for short positions, but only with tight risk controls and clear confirmation of trend continuation.
📝 Disclaimer:
This analysis is strictly for study and educational purposes. It is not financial advice or a recommendation to take a trading position. Please consult a licensed financial advisor before making any investment decisions.
