FTSE INTRADAY sideways consolidation continuationrend: Overall trend remains bullish, supported by rising price action.
Recent Movement: Price is in a sideways consolidation phase after a strong uptrend.
Key Levels
Support:
8680 – Key level from prior consolidation.
8625, then 8510 – Next supports if 8680 breaks.
Resistance:
8850 – First upside target.
8910, then 9020 – Further resistance levels on continued strength.
Trading Scenarios
Bullish Scenario:
A pullback to 8680 followed by a bounce could lead to a move towards 8850, then higher to 8910 and 9020.
Bearish Scenario:
A confirmed break and daily close below 8680 would weaken the bullish case. In that case, expect a potential drop to 8625, then 8510.
Conclusion
The FTSE remains bullish, but a short-term pullback is possible. A bounce from 8680 would confirm trend strength. Watch 8680 closely — holding above favors bulls; a break below shifts sentiment to bearish.
This communication is for informational purposes only and should not be viewed as any form of recommendation as to a particular course of action or as investment advice. It is not intended as an offer or solicitation for the purchase or sale of any financial instrument or as an official confirmation of any transaction. Opinions, estimates and assumptions expressed herein are made as of the date of this communication and are subject to change without notice. This communication has been prepared based upon information, including market prices, data and other information, believed to be reliable; however, Trade Nation does not warrant its completeness or accuracy. All market prices and market data contained in or attached to this communication are indicative and subject to change without notice.
UK100 trade ideas

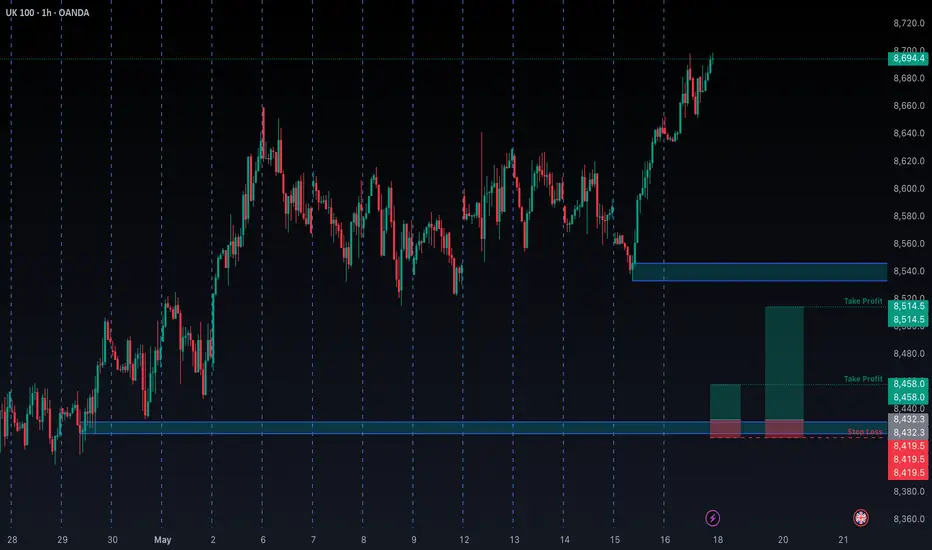
UK100/FTSE100 - time to short slowlyTeam, let's kill the UK100/FTSE100
last night, we got target hit both in 15 minutes during LIVE trading. Today we are going to short the UK slowly according to the strategy set out
Please note: Target 1 will be around 8778-8771
Once it hits, take 70% and bring a stop loss to BE
Target 2 - will unload the remaining 30% volume.
Please carefully look at the chart. There is a section where if the market goes against you, please double up at that section; that would allow us to make double the profit. However, when it pulls down to our original short, we can take those profits.

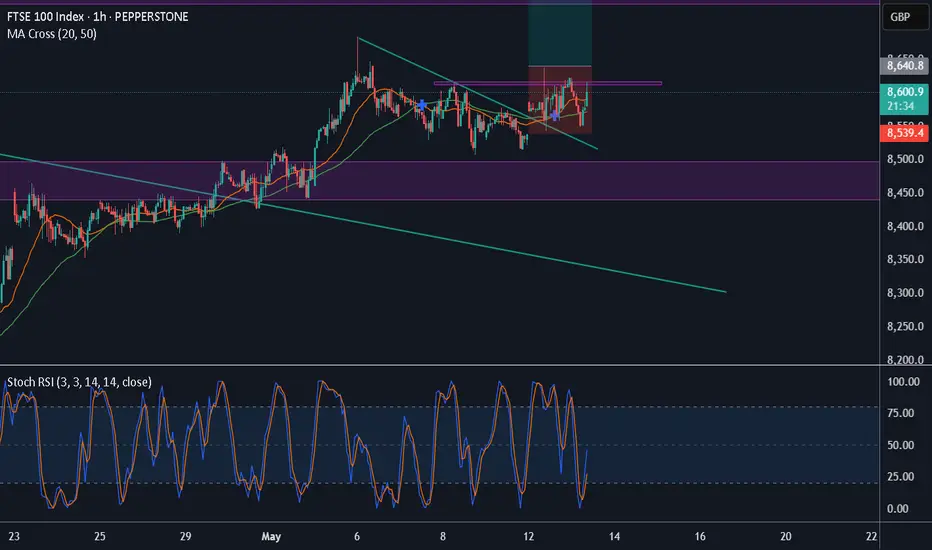
FTSE Coils Beneath Key ResistanceThe FTSE 100 finds itself at a crossroads. After an impressive V-shaped recovery from the April lows, the index has spent the past two weeks compressing beneath a well-established resistance zone. Tension is building and we’re left asking the critical question: will this be a great shorting opportunity or the start of a trend leg higher?
Is a Breakout or Fakeout Coming?
What makes this resistance area particularly significant is its origin. These are the same levels that capped the market back in February and March, just before a sharp sell-off triggered by sweeping tariff policies introduced by Donald Trump. That sell-off reset sentiment sharply, and now, with prices having clawed their way back, the FTSE is once again knocking on the door but hesitating.
On the daily chart, the price action has formed a tight sideways range. The 50-day and 200-day moving averages are both marginally rising, but they’re essentially flat, a signal that the market is in pause mode rather than trending. Volume, too, has returned to average levels, offering no strong clues from participation. This isn’t momentum building, it’s pressure tightening. The spring is coiling.
Zooming into the hourly chart reveals more detail… The FTSE is forming a wedge or price funnel, with swing highs gradually dropping while swing lows climb. This narrowing formation reflects indecision on both sides and underlines just how tightly wound this market has become.
Breakouts from these types of patterns can be significant, but they can also be deceptive. With a major resistance zone in play, traders should be on guard for false moves that lure in breakout chasers only to reverse and trap them. Patience is key. The real tell will be in the confirmation: a decisive daily close beyond the range, accompanied by a surge in volume, could mark the moment when tension finally gives way to trend.
Until then, the FTSE remains in limbo coiling, waiting, and keeping traders on edge.
UK100 Daily Candle Chart
Past performance is not a reliable indicator of future results
UK100 Hourly Candle Chart
Past performance is not a reliable indicator of future results
Disclaimer: This is for information and learning purposes only. The information provided does not constitute investment advice nor take into account the individual financial circumstances or objectives of any investor. Any information that may be provided relating to past performance is not a reliable indicator of future results or performance. Social media channels are not relevant for UK residents.
Spread bets and CFDs are complex instruments and come with a high risk of losing money rapidly due to leverage. 85.24% of retail investor accounts lose money when trading spread bets and CFDs with this provider. You should consider whether you understand how spread bets and CFDs work and whether you can afford to take the high risk of losing your money.


FTSE 100 moving to 10,000 mark !Would this prediction comes true? Honestly, I dunno and why 10,000 and not higher ? This is a psychological number that I think it needs to cross first so that is why I choose it.
Again, I have no profit target (this time, my revised strategy) but a SL in place. When the market moves in my favour, I would adjust my SL to breakeven but learning not to take partial profits or even close the position.
So, yes, this would be a relatively longer swing trade which I dunno how long it would take to close, hopefully not unless I am stopped out.
If you a short selling this index for whatever reasons, I like to hear your views although I will still go LONG. Best of luck to us both.

FTSE100 INTRADAY key trading level at 8680Trend: Overall trend remains bullish, supported by rising price action.
Recent Movement: Price is in a sideways consolidation phase after a strong uptrend.
Key Levels
Support:
8680 – Key level from prior consolidation.
8625, then 8510 – Next supports if 8680 breaks.
Resistance:
8850 – First upside target.
8910, then 9020 – Further resistance levels on continued strength.
Trading Scenarios
Bullish Scenario:
A pullback to 8680 followed by a bounce could lead to a move towards 8850, then higher to 8910 and 9020.
Bearish Scenario:
A confirmed break and daily close below 8680 would weaken the bullish case. In that case, expect a potential drop to 8625, then 8510.
Conclusion
The FTSE remains bullish, but a short-term pullback is possible. A bounce from 8680 would confirm trend strength. Watch 8680 closely — holding above favors bulls; a break below shifts sentiment to bearish.
This communication is for informational purposes only and should not be viewed as any form of recommendation as to a particular course of action or as investment advice. It is not intended as an offer or solicitation for the purchase or sale of any financial instrument or as an official confirmation of any transaction. Opinions, estimates and assumptions expressed herein are made as of the date of this communication and are subject to change without notice. This communication has been prepared based upon information, including market prices, data and other information, believed to be reliable; however, Trade Nation does not warrant its completeness or accuracy. All market prices and market data contained in or attached to this communication are indicative and subject to change without notice.

FTSE BEAR Time for another short on this product
We need to break the Blue zone to confirm the targets

FTSE INTRADAY sideways consolidation supported at 8680Trend: Overall trend remains bullish, supported by rising price action.
Recent Movement: Price is in a sideways consolidation phase after a strong uptrend.
Key Levels
Support:
8680 – Key level from prior consolidation.
8625, then 8510 – Next supports if 8680 breaks.
Resistance:
8850 – First upside target.
8910, then 9020 – Further resistance levels on continued strength.
Trading Scenarios
Bullish Scenario:
A pullback to 8680 followed by a bounce could lead to a move towards 8850, then higher to 8910 and 9020.
Bearish Scenario:
A confirmed break and daily close below 8680 would weaken the bullish case. In that case, expect a potential drop to 8625, then 8510.
Conclusion
The FTSE remains bullish, but a short-term pullback is possible. A bounce from 8680 would confirm trend strength. Watch 8680 closely — holding above favors bulls; a break below shifts sentiment to bearish.
This communication is for informational purposes only and should not be viewed as any form of recommendation as to a particular course of action or as investment advice. It is not intended as an offer or solicitation for the purchase or sale of any financial instrument or as an official confirmation of any transaction. Opinions, estimates and assumptions expressed herein are made as of the date of this communication and are subject to change without notice. This communication has been prepared based upon information, including market prices, data and other information, believed to be reliable; however, Trade Nation does not warrant its completeness or accuracy. All market prices and market data contained in or attached to this communication are indicative and subject to change without notice.

Trendline Continuation BreakoutThe price has broken the trendline followed by a pullback, now the price looks to go long after breaking the pullback trendline
time to go long
WE ONLY TRADE PULLBACKS

Elliott Wave Outlook: FTSE to Signal Market Direction SoonThe short-term Elliott Wave outlook for FTSE indicates that wave II concluded at 7560.5. This marked the start of an upward movement in wave III. Wave III is unfolding as a five-wave impulse structure, characterized by a series of higher highs and higher lows. From the wave II low, wave 1 advanced to 8021.77, followed by a pullback in wave 2 to 7599.56. The Index then resumed its upward trajectory in wave 3, with its internal subdivisions further defining the bullish momentum.
Within wave 3, wave ((i)) peaked at 8166.53, followed by a corrective wave ((ii)) that found support at 7862.72. The subsequent rally in wave ((iii)) reached 8798.46, and a minor pullback in wave ((iv)) ended at 8604.8. The Index is now poised to continue its upward trend, likely completing the five-wave rally that began from the April 7 wave II low. Once this rally concludes, a larger corrective pullback is anticipated. The pullback is potentially unfolding in 3, 7, or 11 swings to correct the prior advance.
Currently, the Index is approaching a critical level, nearing a break above the previous wave I peak of 8908.82, recorded on March 4, 2025. A decisive move above this level would confirm that wave II is firmly in place, ruling out the possibility of a double correction. Such a breakout would provide strong confirmation of the bullish market direction, signaling continued upward momentum in the near term.

FTSE 100 Wave Analysis – 28 May 2025
- FTSE 100 index reversed from key resistance level 8800.00
- Likely to fall to support level 8650,00
The FTSE 100 index recently reversed from the key resistance level 8800.00 (which has been steadily reversing the index from the start of February).
The resistance area near the resistance level 8800.00 was strengthened by the upper daily Bollinger Band.
Given the overbought daily Stochastic, FTSE 100 index can be expected to fall to the next support level 8650,00 (former top of wave (1) from the start of May).

FTSE INTRADAY bullish uptrend consolidation supported at 8600Trend: Overall trend remains bullish, supported by rising price action.
Recent Movement: Price is in a sideways consolidation phase after a strong uptrend.
Key Levels
Support:
8600 – Key level from prior consolidation.
8480, then 8430 – Next supports if 8600 breaks.
Resistance:
8850 – First upside target.
8910, then 9020 – Further resistance levels on continued strength.
Trading Scenarios
Bullish Scenario:
A pullback to 8600 followed by a bounce could lead to a move towards 8850, then higher to 8910 and 9020.
Bearish Scenario:
A confirmed break and daily close below 8600 would weaken the bullish case. In that case, expect a potential drop to 8480, then 8430.
Conclusion
The FTSE remains bullish, but a short-term pullback is possible. A bounce from 8600 would confirm trend strength. Watch 8600 closely — holding above favors bulls; a break below shifts sentiment to bearish.
This communication is for informational purposes only and should not be viewed as any form of recommendation as to a particular course of action or as investment advice. It is not intended as an offer or solicitation for the purchase or sale of any financial instrument or as an official confirmation of any transaction. Opinions, estimates and assumptions expressed herein are made as of the date of this communication and are subject to change without notice. This communication has been prepared based upon information, including market prices, data and other information, believed to be reliable; however, Trade Nation does not warrant its completeness or accuracy. All market prices and market data contained in or attached to this communication are indicative and subject to change without notice.

So far so good, UKXLet's wait for it to break above the resistance line and then go long/accumulate.
Be patient and DYODD

"UK100 Grand Heist: Bullish Loot Plan with Thief Trading Style!🌍 Hello, Global Wealth Warriors! Ciao, Salut, Guten Tag, Ola! 🌟
Fellow Profit Pirates & Market Mavericks, 💸⚡
Unveiling our cunning blueprint to plunder the "UK100/FTSE100" Index Market, crafted with 🔥Thief Trading’s razor-sharp technical and fundamental insights🔥. Stick to the chart’s game plan, zoned in on a long entry. Our mission? Slip out near the high-stakes ATR Zone Level—a perilous spot with overbought vibes, consolidation, trend flips, and traps where bearish bandits lurk. 🏴☠️💰 Celebrate your wins, traders—you’ve earned it! 🎉
📈 **Entry Point**: The vault’s unlocked! Grab the bullish bounty at current prices—the heist is live!
💡 Pro Tip: Set buy limit orders on a 15 or 30-minute timeframe, targeting recent or swing lows/highs. Don’t forget to set chart alerts for precision! 🚨
🛑 **Stop Loss**:
📍 Thief SL parked at the recent/swing low on the 4H timeframe (8500.0) for day/swing trades.
📍 Tailor your SL to your risk appetite, lot size, and number of orders. Stay sharp!
🎯 **Target**: Aim for 8850.0 or make a swift exit just before.
👀 **Scalpers, Listen Up**: Stick to long-side scalping. Got deep pockets? Dive in now! Otherwise, join swing traders for the grand heist. Use trailing SL to shield your loot. 💰
💹 **Market Pulse**: The UK100/FTSE100 is in a neutral zone but leaning bullish, fueled by key drivers. ☝
🌐 Dive into fundamentals—macro economics, COT reports, geopolitical updates, sentiment, intermarket analysis, and index-specific trends. Check the linkss for the full scoop! 🔗🌍
⚠️ **Trading Alert**: News can shake the market! 📰
🔐 Protect your positions:
- Pause new trades during news releases.
- Use trailing stop-loss to lock in gains.
💪 **Join the Heist**: Smash the Boost Button to supercharge our robbery squad! 💥 With Thief Trading Style, we rake in profits daily with ease. 🚀 Your support fuels our market conquests. 🤝❤️
Stay tuned for the next daring heist, money makers! 🤑🐱👤🎯

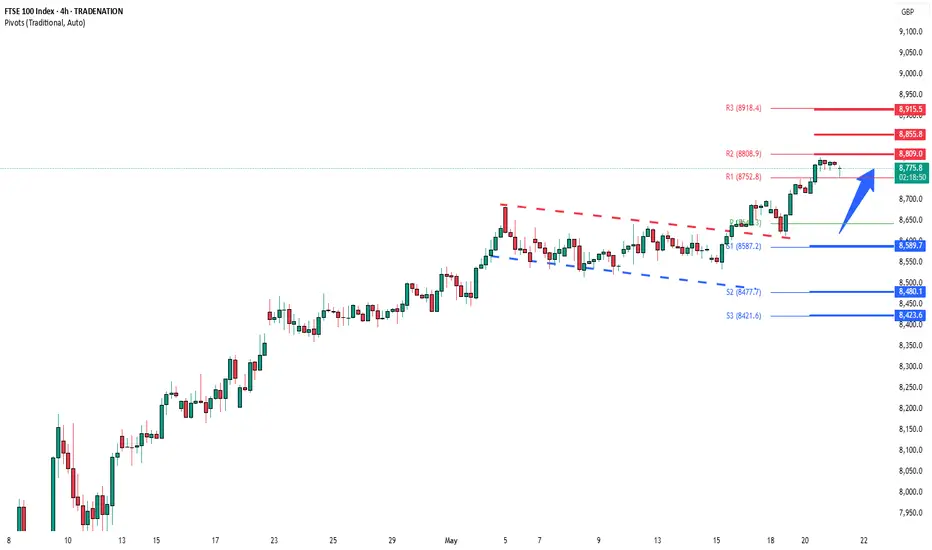
FTSE INTRADAY bullish continuaation breakoutThe FTSE 100 is showing bullish momentum, supported by an ongoing uptrend. Recent price action suggests a breakout above a period of sideways consolidation, indicating strong buying interest.
Key Support: 8590 – This was the previous consolidation zone and now acts as a critical level.
If the index pulls back to 8590 and holds, it may resume the uptrend with potential upside targets at:
8810 (near-term resistance)
8850, then 8920 (longer-term targets)
Bearish Scenario: A daily close below 8590 would weaken the bullish case and could lead to a decline toward:
8480 (next support)
Then 8420 if selling pressure increases
Conclusion:
The FTSE 100 remains bullish above 8590. Watch for a bounce from this level to confirm further upside. A break below would shift the outlook to bearish in the short term.
This communication is for informational purposes only and should not be viewed as any form of recommendation as to a particular course of action or as investment advice. It is not intended as an offer or solicitation for the purchase or sale of any financial instrument or as an official confirmation of any transaction. Opinions, estimates and assumptions expressed herein are made as of the date of this communication and are subject to change without notice. This communication has been prepared based upon information, including market prices, data and other information, believed to be reliable; however, Trade Nation does not warrant its completeness or accuracy. All market prices and market data contained in or attached to this communication are indicative and subject to change without notice.

FTSE INTRADAY bullish breakout continuation above 8590The FTSE 100 is showing bullish momentum, supported by an ongoing uptrend. Recent price action suggests a breakout above a period of sideways consolidation, indicating strong buying interest.
Key Support: 8590 – This was the previous consolidation zone and now acts as a critical level.
If the index pulls back to 8590 and holds, it may resume the uptrend with potential upside targets at:
8810 (near-term resistance)
8850, then 8920 (longer-term targets)
Bearish Scenario: A daily close below 8590 would weaken the bullish case and could lead to a decline toward:
8480 (next support)
Then 8420 if selling pressure increases
Conclusion:
The FTSE 100 remains bullish above 8590. Watch for a bounce from this level to confirm further upside. A break below would shift the outlook to bearish in the short term.
This communication is for informational purposes only and should not be viewed as any form of recommendation as to a particular course of action or as investment advice. It is not intended as an offer or solicitation for the purchase or sale of any financial instrument or as an official confirmation of any transaction. Opinions, estimates and assumptions expressed herein are made as of the date of this communication and are subject to change without notice. This communication has been prepared based upon information, including market prices, data and other information, believed to be reliable; however, Trade Nation does not warrant its completeness or accuracy. All market prices and market data contained in or attached to this communication are indicative and subject to change without notice.
UK100 Short IdeaHTF liquidity swept + Tokyo High swept along with monday high. Looking for a retrace in the 1h liq area . The target is conservative, this can go even lower towards monday low or prev week low .

London Stock Market Rally: From 7500 to 8700 The London Stock Index rally has commenced at the 7500 mark, with expectations that the upward movement will reach a peak around the 8700-pound level.
Following this anticipated high point, a price correction is likely to begin, moving towards the possible first and second target levels.
keeping an eye on potential opportunities during the correction phase.

Trendline Break Continuation The price has been on a bullish trend and broke a larger trendline, now we see a smaller trendline as a continuation, followed by a pullback and now the price looks to make a bullish impulse at a higher high
WE ONLY TRADE PULLBACKS
UK100 - STRATEGY TO MAKE MILLIONSTeam, you have been killing the UK100 last week,
YESTERDAY, we will the AUS200
every day is a winning for us. I am about to make a video of education on how to kill the market daily!
Today we are preparing to short UK at 8742-8756
DOUBLE UP the short at 8785-96
Target range 1 at 8705-15
Target range 2 at 8672-8658
Remember: be humble, be focused and always care about risk management. Now, let's kill the UK100 market together.

FTSE 100: Bearish Order flowBearish Crab Pattern via the 1H timeframe. Let's see how this plays out.
There's also an order block at the bottom on the H4 timeframe. Maybe price could go bearish to mitigate it. As they say, false move beginning of the week.

Potential Buy Zone on FTSEI have several swing trade zones marked up on the FTSE, here's one of them.
Potential Buy Zone for the FTSEI have several swing trade zones marked up on the FTSE, here's one of them.
