$DXY Repeating 2016 Post-Election I have highlighted the 2016 to 2020 Presidential Elections time period and then pasted that timeframe onto the 2024 election and found that the pattern is going along very similarly to Trump 1.0.
If we assume that the future unfolds the same as last time, which is low probability, of course, then the future will unfold as shown in the yellow bars going into the future, as shown.
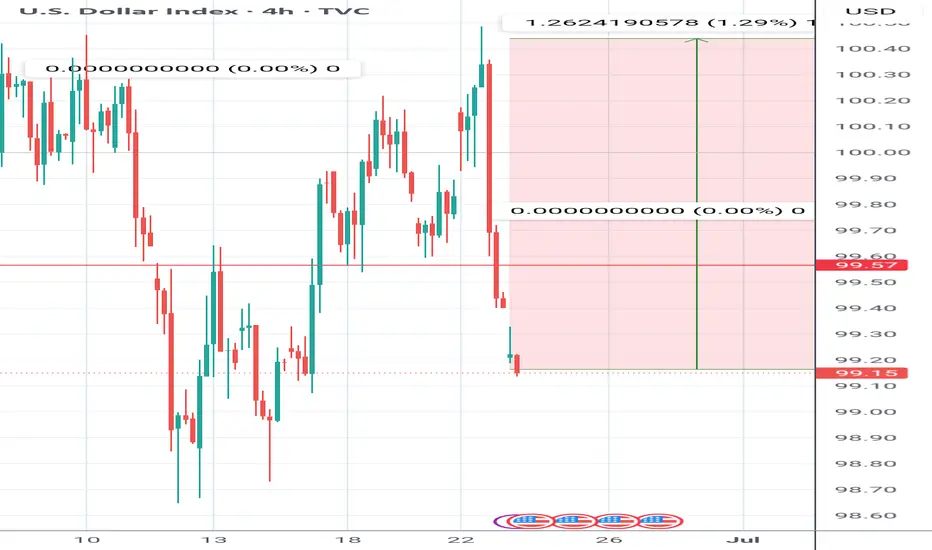
Initially in 2016 post election there was a 7% rally in the U.S. Dollar Index and then a 15% retreat for the following year. So far in 2025 we have seen the same rally and a similar decline, but only faster this time.
It would appear as thought the bulk majority of the declines in the TVC:DXY are over at this time with perhaps 4% further downside over the balance of the year.
The Dollar Index has been useful for predicting changes in the earnings estimates for the S&P500 in the USA due to the high percentage of earnings coming back to the US for quarterly reporting. I have posted a few charts in the past which have been helpful at determining the risk in the stock market.
The behavior of the global central banks has certainly had its impact on monetary aggregates and inflation. The policy response since the Covid Pandemic has been for maximum liquidity and maximum Government spending to keep the global economy afloat. The post-Covid response is now coming to a head along with new policy directives to cut wasteful Government spending and to reduce inflation (caused the Gov't spending).
Global investors have flocked to the US for access to high technology stocks and have driven up the value of US assets to extreme levels compared to other markets. This adjustment phase where investors remove money from overvalued, or highly valued, US assets back to other markets has created a wave of selling in the US Dollar and US listed equities.
What does the future hold? We never know but we sure can learn from what happened in the past by looking at charts just like this one to see what may happen. Looks like a bounce in the TVC:DXY from here, followed by a new low and then a rebound into the next few years.
All the best,
Tim
April 22, 2025 1:16PM EST TVC:DXY 98.78 last
USDX trade ideas

DOLLAR INDEX the US Dollar Index (DXY) is trading around 97.704 -98.572,0.34% . The index has been under pressure due to easing geopolitical tensions ,Particularly optimism about a ceasefire between Israel and Iran and expectations of Federal Reserve rate cuts later in the year. The DXY remains below its 100-day,200 day exponential moving average (EMA), 100day, 200 day simple moving average with bearish momentum supported by interest rate hold and expected rate cut before the end of the year.
the 10 year united states bond yield is trading around 4.279%-4.324%,we have seen gold sell off at 3336-3334 on dollar rally.
Market Outlook:
The DXY is attempting to stabilize but remains in a bearish phase until it decisively breaks above 100 resistance.
the future of the dollar index is depending on Fed policy and global economic conditions.
Summary:
The DXY is currently weak around 97.88 -98.00 due to easing geopolitical risks and Fed rate cut expectations.
Bearish momentum dominates below the 100-day EMA, 200-day EMA, 100-day SMA AND 200 day SMA
A break above 100 would be needed to signal a bullish reversal, if the retest to broken supply at 100 could become demand floor .
#dxy

DXY | daily outlookYALL LIKE THE NEW FACE LIFT??
Price tapped into a refined demand zone after breaking short-term structure, confirming bullish intent. Entry was executed on the mitigation of a prior imbalance, with confluence from BOS (Break of Structure) and trendline liquidity sweep.
Now aiming for the next H1 supply zone where price is likely to react. Bullish continuation expected as long as price holds above 98.080.
TP set just before the high to secure profits before potential distribution.
PLS BOOST & LIKE FOR MORE...

KOG - DXYQuick look at the Dollar index.
We've applied the red boxes to it and and we'll wait for the defence to break. If we can break this upside, our target level to the dollar is way up.
As always, trade safe.
KOG

DXY Liquidity Sweep Into POI Before Bullish Expansion 🔍 Key Levels & Zones
Extreme POI: Price is approaching a major demand zone (marked as EXTREME - POI), expecting reaction from this area.
Fair Value Gap (FVG): Price recently filled a small FVG at ~97.75 before pulling back.
Target: Implied move towards 98.95 area after internal liquidity is swept.
Scenario
Price tapped into the FVG and showed reaction — but no shift yet.
Anticipating liquidity sweep of recent lows into the Extreme POI (~97.11).
If bullish reaction confirms from POI, expecting strong move to:
Reclaim FVG
Break above IMB
Reach target zone at 98.95
🧠 Confluences
50 EMA resistance aligning with FVG — short-term sell pressure.
Classic Wyckoff accumulation schematic potential in POI zone.
Liquidity below marked lows for smart money grab.
⚠️ Invalidation
If price breaks and holds below 97.00 with bearish structure, bullish scenario is invalid.
Bias: Short-term bearish, then bullish continuation.

Dollar Index Analysis: Wedge + Powell Outlook – June 25, 2025📉 Technical Outlook: Bearish Rising Wedge + Liquidity Sweep Setup
TVC:DXY The Dollar Index (DXY) is currently trading within a rising wedge pattern, typically a bearish structure. We're anticipating a fake breakdown, potential sweep of the key demand zone, followed by a reversal move targeting key highs.
🔍 Key Technical Zones
📥 Demand Zone (Buy Area):
🔵 97.50 – 97.20 = Institutional accumulation + unfilled orders
🚫 Invalidation Level (Stop-Loss) :
❌ 96.70 = Clean break below confirms full bearish continuation
🎯 Target Projections (Upside Levels) :
TP1: 99.00
TP2: 100.00
TP3: 101.04 (HTF swing high liquidity cleanout)
🧠 Summary Setup :
Downtrend
Rising wedge formation
Sweep of 97.20 possible
Watch for fakeout & reversal play toward 101.04
🏛️ Fundamental Analysis – Powell’s Testimony Insights
Fed Chair Powell highlighted the following during his recent testimony:
🔄 “We’re not there yet on inflation” — Core services remain sticky
🛑 No immediate rate cuts — Growth is slowing but not crashing
🕰 Rate cuts likely postponed to Q4 2025
🔐 “Real rates are restrictive enough” = No more hikes expected
💡 Implication for DXY :
✅ Short-term bullish bias as higher U.S. yields remain attractive if rate cuts are delayed.
🌍 Macro Context Snapshot (as of June 25, 2025)
🇺🇸 US Disinflation: CPI & PCE easing, but not collapsing
🇪🇺 ECB Cut in June: Euro may weaken further
🇯🇵 BOJ Policy Unclear: USD/JPY likely volatile
🌐 Global Risk Appetite High: Volatility may return with geopolitical events
🔥 Watch This: Trade Tariff Narrative Heating Up
🚨 New U.S. Tariff Signals on Chinese tech and EU autos are resurfacing. This could:
Push inflation risk higher
Delay Fed’s easing timeline
Add support to USD short term as markets price in geopolitical tension and uncertainty
📌 Trading Strategy Recap :
Monitor wedge support near 97.20
Look for fakeout/sweep and bullish reversal
Target 99–101 zone on rebound
Stay alert to Powell/Fed rhetoric + tariff news
If you find this analysis helpful, Like, Comment, and Follow for more DXY, gold, and macro trades!

DXY Bearish - 4HR Sell Side LiquidityDXY Bearish - 4HR Sell Side Liquidity - very likely DXY will push down this week and take out the SSL

TIME FOR THE DOLLAR TO STRENGTHEN OR FURTHER WEAKNESS.So what are we lookin at? We have been looking at the weakest price in dollar yet.Yesterday we tested the yearly lows at 97.700 which we are using as current baseline. I will mark up that price range to use as our support. Geopolitical tensions are cooling off as Trump called for ceasefire between the two war torn nations but we still have lots of economic data flowing in. Most attention fall towards Fed chair Powell speech as this will shape up the direction of the dollar going forward as we head to a new month. Correction higher means USDJPY will rise as we are having a steady Yen currency. We saw the dollar fail to hold above 99.300 which is our nearest resistance level marked by a horizontal ray.So focus is on those two price levels so as to enable us find opportunities to trade.

Overlap resistance ahead?The US Dollar Index (DXY) is rising towards the pivot, which is an overlap resistance and could reverse to the 1st support that lines up with the 127.2% Fibonacci extension.
Pivot: 98.50
1st Support: 97.21
1st Resistance: 99.30
Risk Warning:
Trading Forex and CFDs carries a high level of risk to your capital and you should only trade with money you can afford to lose. Trading Forex and CFDs may not be suitable for all investors, so please ensure that you fully understand the risks involved and seek independent advice if necessary.
Disclaimer:
The above opinions given constitute general market commentary, and do not constitute the opinion or advice of IC Markets or any form of personal or investment advice.
Any opinions, news, research, analyses, prices, other information, or links to third-party sites contained on this website are provided on an "as-is" basis, are intended only to be informative, is not an advice nor a recommendation, nor research, or a record of our trading prices, or an offer of, or solicitation for a transaction in any financial instrument and thus should not be treated as such. The information provided does not involve any specific investment objectives, financial situation and needs of any specific person who may receive it. Please be aware, that past performance is not a reliable indicator of future performance and/or results. Past Performance or Forward-looking scenarios based upon the reasonable beliefs of the third-party provider are not a guarantee of future performance. Actual results may differ materially from those anticipated in forward-looking or past performance statements. IC Markets makes no representation or warranty and assumes no liability as to the accuracy or completeness of the information provided, nor any loss arising from any investment based on a recommendation, forecast or any information supplied by any third-party.

DXYThe DXY (U.S. Dollar Index) measures the strength of the U.S. dollar against a basket of major world currencies — mainly the euro, yen, pound, Canadian dollar, Swedish krona, and Swiss franc.
What it tells you:
• If DXY rises → The dollar is getting stronger overall.
• If DXY falls → The dollar is weakening.
Why DXY matters:
• It reflects global demand for the U.S. dollar.
• It reacts to U.S. interest rate decisions, inflation data, recession fears, geopolitical tensions, etc.
• Traders and investors use it to gauge the dollar’s trend — helping in decisions like shorting EUR/USD, buying gold, or trading commodities.

DXY hello trader, the price of DXY has reached major support level, price will likely reverse after fully liquid sweep on bearish side in daily tf... price could test the 97.7 in 1hr tf, so look for proper reversal in lower tf also, however weekly handle already did liquidity sweep of previous weekly candle. overall the target is 110 for now or could breakout.. price above 200ma will be a good sign of bullish momentum..
good luck to all

24th JuneTA: Many confluences for a bearish bias. Only confirmation needed for high probability price action is running (closing below 4H SL) on 1H. We have to exercise some caution, because price is still in the area of the monthly sweep. For a trade PA has to give us optimal behaviour.
News: Powell testifies at 10:00am. This could lead to a very quick move below the swept monthly low.

DXY: 2 Cycles InterconnectedDownward tilt defines highs of '01 and '22 at phi
Topologically looks like expanded version of previous cycle. Relating them creates confluence zones.

Price action Since the dxy failed to make a lower low and failed to break below but above this is a scenario that might play out
Dollar Back to bearishAmazing run on the liqudity I outlined over the weekend. We literally stabbed through with a few pips and massive rejection. This is all war related but you see how these levels get appreciated all the time.
Insane rejection after taking the liquidity

Bearish drop?US Dollar Index (DXY) has reacted off the pivot and could drop to the 1st support.
Pivot: 98.59
1st Support: 97.69
1st Resistance: 99.25
Risk Warning:
Trading Forex and CFDs carries a high level of risk to your capital and you should only trade with money you can afford to lose. Trading Forex and CFDs may not be suitable for all investors, so please ensure that you fully understand the risks involved and seek independent advice if necessary.
Disclaimer:
The above opinions given constitute general market commentary, and do not constitute the opinion or advice of IC Markets or any form of personal or investment advice.
Any opinions, news, research, analyses, prices, other information, or links to third-party sites contained on this website are provided on an "as-is" basis, are intended only to be informative, is not an advice nor a recommendation, nor research, or a record of our trading prices, or an offer of, or solicitation for a transaction in any financial instrument and thus should not be treated as such. The information provided does not involve any specific investment objectives, financial situation and needs of any specific person who may receive it. Please be aware, that past performance is not a reliable indicator of future performance and/or results. Past Performance or Forward-looking scenarios based upon the reasonable beliefs of the third-party provider are not a guarantee of future performance. Actual results may differ materially from those anticipated in forward-looking or past performance statements. IC Markets makes no representation or warranty and assumes no liability as to the accuracy or completeness of the information provided, nor any loss arising from any investment based on a recommendation, forecast or any information supplied by any third-party.

EUR/USD Macro Structure | Don’t Miss the Cycle ShiftAfter reviewing the 12M, 2M, and currency indexes — this isn’t just a bounce, it’s a potential macro reversal.
EUR/USD (2M Chart)
We’ve now got two Morning Star Dojis followed by a bullish engulfing — price is climbing steadily toward 1.16319 (neckline zone). If we break and retest clean, 1.25560 becomes a high-probability target. I view this as the neckline of a multi-year W-formation.
💶EUR Index (16D Chart)
The breakout has already occurred. Retest is happening now around the 1.057 zone. Fibonacci structure supports continuation, and volume confirms strength. If momentum holds, 1.085 – 1.130+ are valid extensions.
💵 USD Index (DXY - 16D Chart)
Meanwhile, the dollar is breaking down from a neckline around 98. If the 97–98 range gives way, we may revisit 88.253, confirming a shift in USD dominance.
🌐 Fundamental Alignment:
The Eurozone is pushing hard for digital transformation, with the ECB advancing legislation on the digital euro. Christine Lagarde has been vocal about blockchain innovation — and XRP’s involvement in cross-border integration is no coincidence.
🎯 Key Price Levels:
1.16319: Neckline (retest zone)
1.25560: Mid-term target
1.60195: Macro expansion (long-term, structure-dependent)
📌 I encourage all traders to zoom out and track structure across multiple timeframes. Sometimes the past holds clues to the future.

USD Bears Show Big Response to Rate Cut TalkThe bearish trend in USD has run for most of this year so far, and this has happened even as many members of the Fed refrain from talking up possible rate cuts. Last week, Jerome Powell once again reiterated that he thought tariffs would produce inflation, and he seemed to dismiss the forecasts that indicated two possible rate cuts in 2025.
Another inflationary factor showed with geopolitical risk, as tensions between the U.S. and Iran threatened to impact oil prices. And given how most consumer products in the U.S. transport via trucks, that could produce vulnerability to inflation from higher oil prices.
But, so far, we've seen a 'buy the rumor, sell the news' phenomenon around that, as Iran's retaliation hasn't seemed to excite markets, with oil prices heading lower after the attack. We've also seen the bid that drove the USD after the weekly open evaporate, and the daily bar is currently showing as a bearish engulfing candlestick.
There's quite a bit of U.S. drive from the calendar for this week including speeches from Jerome Powell along with numerous other Fed members. Friday brings the Fed's preferred inflation gauge, and sellers, at this point, seem to have an open door to make a run at the lows in USD. - js

Potential Bullish Scenario for DXY, target objective is 99.392Higher timeframe analysis
As discussed in last week's analysis of the DXY, the higher timeframe draw on liquidity is the bearish monthly Fair value gap set at 101.977. This warrants a higher timeframe bullish bias until this level has been achieved.
Intermediate timeframe analysis
We note the relative equal highs on the daily and 1H chart at 99.392. This serves as a intermediate timeframe draw on liquidity and target objective.
Also note that the buyside of the curve of the market maker buy model has commenced which further fuels bullish sentiment.
Scenario 1
On the 1H chart, note the relative equal lows at 98.482. These lows are expected to be ran to serve as a liquidity primer for the bullish 1H order block at 98.436 which is expected to be respected and held. This poses a rather handsome risk to reward ratio.
Scenario 2
Should price push past the invalidation point of the bullish 1H order block we could see it head to the bullish 1H order block at the initial accumulation at 98.219. The reward on this setup would make up for the loss of scenario 1.
Disclaimer
The above analysis is intended for educational purposes only and should not be interpreted as financial advice.

DXY: Target Is Up! Long!
My dear friends,
Today we will analyse DXY together☺️
The price is near a wide key level
and the pair is approaching a significant decision level of 98.274 Therefore, a strong bullish reaction here could determine the next move up.We will watch for a confirmation candle, and then target the next key level of 98.606 .Recommend Stop-loss is beyond the current level.
❤️Sending you lots of Love and Hugs❤️

USXUSD HOTW SetUSXUSD HOTW Set
Lower prices for DXY.
Everyone and their mum think DXY will surge because of USA vs Iran, perfect time to sell DXY.
H4 Close like this confirms this idea for me.
Let's see...

DXY Daily And 4hr chart analaysis The DXY remains in a bearish trend and is expected to continue declining toward the 99.442 level. From there, a potential reversal could occur, with a projected target around 95.75. However, while I anticipate the index may reach that level, there’s also a realistic possibility it could reverse earlier around the 96.00 area and resume a bullish trend from that point.

DXY SELLS - (DOLLAR FALLING) Like this post to stay tuned to more updates that will follow in the comment section below
