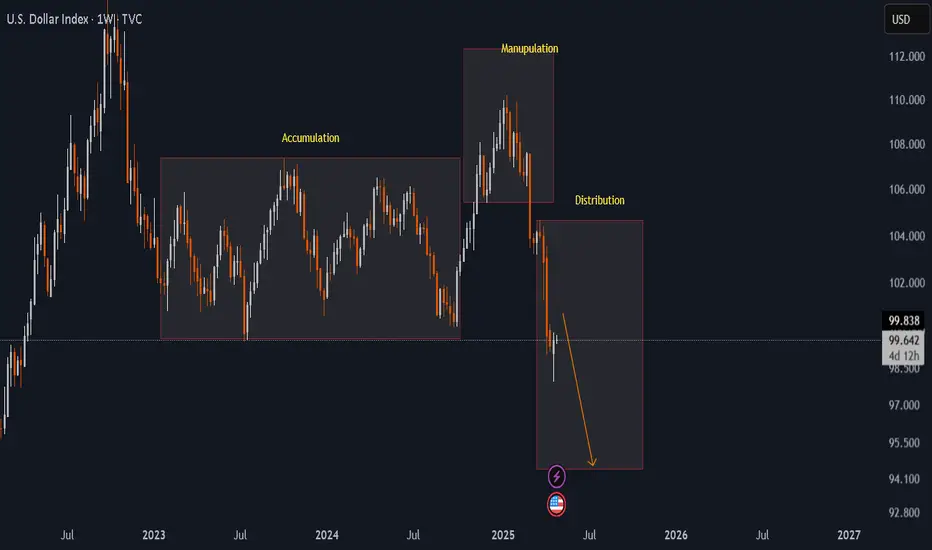
DXY updateDXY performing exactly what it performed when Last time TRump became president.
and Technically created a very clear AMD structure.
Now it is in Distribution zone...
USDX trade ideas
USD StrengthGiven the current technical indicators and fundamental backdrop, the DXY may continue to face downward pressure in the short term. However, strong economic fundamentals and potential shifts in Federal Reserve policy could provide support, leading to a stabilization or potential rebound.

DXYU.S Dollar Index
- Completed " 12345 " Impulsive Waves and " AB " Corrective Waves
- Break of Structure
- Resistance Level
- Consolidation Phase
- Order Block

Heading into pullback resistance?US Dollar Index (DXY) is rising towards the pivot which is a pullback resistance and could reverse to the 1st support which acts as a pullback support.
Pivot: 100.27
1st Support: 98.32
1st Resistance: 101.77
Risk Warning:
Trading Forex and CFDs carries a high level of risk to your capital and you should only trade with money you can afford to lose. Trading Forex and CFDs may not be suitable for all investors, so please ensure that you fully understand the risks involved and seek independent advice if necessary.
Disclaimer:
The above opinions given constitute general market commentary, and do not constitute the opinion or advice of IC Markets or any form of personal or investment advice.
Any opinions, news, research, analyses, prices, other information, or links to third-party sites contained on this website are provided on an "as-is" basis, are intended only to be informative, is not an advice nor a recommendation, nor research, or a record of our trading prices, or an offer of, or solicitation for a transaction in any financial instrument and thus should not be treated as such. The information provided does not involve any specific investment objectives, financial situation and needs of any specific person who may receive it. Please be aware, that past performance is not a reliable indicator of future performance and/or results. Past Performance or Forward-looking scenarios based upon the reasonable beliefs of the third-party provider are not a guarantee of future performance. Actual results may differ materially from those anticipated in forward-looking or past performance statements. IC Markets makes no representation or warranty and assumes no liability as to the accuracy or completeness of the information provided, nor any loss arising from any investment based on a recommendation, forecast or any information supplied by any third-party.

Bullish USIndexCurrently looking at inverted H NYSE:S and also inside channel trading which might also serve as bull flag pattern once broken to the upside. This would mean gold wil be bearish

possibility of uptrendThe upward trend is expected to start according to the specified directions and if the price breaks through the resistance area, confirmation of the upward trend will be possible.

DXY start monthly bearish trend monitoring 94.8DXY start monthly bearish trend monitoring 94.8
whoever hate Trump tarif could just dump the dollar
it's a monthly bearish trend, need 1 or 2 year to go back to above 100
make cheap dollar, lower interest rate
will see a lot of new debt and print money before dollar fly again

DXY ... Dollar Index looks not as clean Gann reviewNot too much to explain here...just see the highlighted areas and see that the Gann box Stacking strikes again with some interesting levels. The light angles are kinds nice, but the most recent one where the price is now seems to be the only thing holding it back from being a green face smash to 96...
Mor Tariff... Mor pain for the Dolla Dolla Bill y' all
This is the larger picture and see as to how I come to these Gann box alignments:
Again...You just find pivots and span them with the box- then stack or slide them with points all being contiguous and you have your price action analysis.
Above chart is the weekly. Just imagine if there was any significance to the 2001 high and then the 2008 lows when it comes to geopolitics or financial situations....one could say:
Its almost like a twin peak, one with a tower on it, just suddenly got hit out of nowhere and then crashed down to the Great Financial Center down below..hmmm VV

Price Action + Fundamentals Point to Dollar StrengthThe current market environment presents compelling evidence for a bullish move in the US Dollar Index (DXY). While some patience is required, the setup is increasingly favorable for the dollar to appreciate in the coming weeks and months.
Key Factors Supporting a Bullish Move:
Monthly Close Above 100.160:
A critical technical level to monitor is the monthly close above 100.160. If achieved, it would signal a strong bullish breakout, setting the stage for a continuation higher. Given current price action and market dynamics, this scenario looks highly probable. However, if the price fails to close above 100.160 and instead breaks below it, we could potentially start looking for short opportunities.
Bond Market Strength (30Y, 10Y, 5Y):
This past week, we witnessed notable strength across the US bond market. Yields declined as prices rose, typically a positive signal for the dollar as it reflects capital inflows into US assets.
COT Report Insights:
The Commitment of Traders (COT) report reveals a critical shift: commercial traders, often considered the "smart money," are beginning to accumulate long positions in the dollar. This change in positioning historically precedes significant bullish moves.
Seasonal Patterns:
Seasonality also favors the dollar during this period. Historically, the dollar tends to strengthen in the mid-year months, aligning perfectly with the current technical and fundamental landscape.
Targets:
Initial Target: 106.120
Given the accumulation signs and supportive macro backdrop, a move towards 106.120 seems very realistic.

DXY Printing a Bullish Triangle??The DXY on the 1 Hr Chart is forming a potential continuation pattern, the Bullish Triangle!
Currently Price is testing the 99.6 - 99.8 Resistance Area and battling with the 200 EMA and 34 EMA Band. The reaction to this conjunction could be pivotal in who overcomes: Buyers or Sellers.
Now during the formation of the potential pattern, Price on the RSI has stayed relatively Above the 50 mark being Bullish Territory suggesting Buyers could win the Bull-Bear battle.
Until Price breaks either the Resistance Area or the Rising Support, we will not have a definitive direction in which USD will strengthen or weaken.
*Wait For The Break*
-If Price breaks the Resistance Area, USD will strength possibly heading to the 100.8 - 101 Area
-If Price breaks the Rising Support, USD will weaken possibly heading to the 98.5 - 98.3 Area
Fundamentally, it is said China and USA are possibly getting closer to potentially ending the Reciprocal Tariff War going on with both sides willing to negotiate.
With the USA being the #1 Consumer of Goods globally, other economies can not afford us to not buy their things so I continue to see the Tariff War more as a Strong-Arm for the USA to be able to negotiate better terms!
USD News:
JOLTS - Tuesday, Apr. 29th
GDP - Wednesday, Apr. 30th
Unemployment Claims / ISM Manu. PMI - Thursday, May 1st
Non-Farm Employment Change / Avg Hourly Earnings / Unemployment Rate - Friday, May 2nd
For all things Currency,
Keep it Current,
With Novi_Fibonacci

Viper Sunday Weekly forecast call. NFP week!On Sunday's we review the markets and look at structure, trends and Candle charts to see what possibly could happen in the week ahead. With a Pullback last week, the markets look poised to have a stronger week leading into NFP.
We cover US30, NAS100, Gold, Oil and Forex pairs. As well as DXY.
Trade carefully, always use proper risk management and this video contains no trade calls or expected results. It is for education purposes only.

DXY Bears in Control ,Will 99.000 Hold or Will 97.600 Be Tested?The US Dollar Index (DXY) remains under strong bearish pressure after failing to reclaim the 100.000 🔼 resistance zone. Price is currently consolidating below 100.000, maintaining a clear bearish structure of lower highs and lower lows.
Currently trading at 99.175, with
Support at: 97.600 🔽
Resistance at: 100.000 🔼, 101.500 🔼, 102.812 🔼
Bias:
🔼 Bullish: A breakout and retest above 100.000 could open room for a move toward 101.500 and 102.812.
🔽 Bearish: As long as price stays below 100.000, sellers remain in control. A breakdown below 97.600 could trigger further downside.
📛 Disclaimer: This is not financial advice. Trade at your own risk.

can DXY change its trend after marking 3rd HLCurrently, the price is a bit away from touching the lower trendline, which is acting as a support level as it will be its latest HL. After that, it would be interesting to know how the dollar moves because, as technical analysis on the chart suggests, DXY should move upwards to maintain that parallel channel. Tariff event, war situation and couple of other major events will also play significant role in determining the next possible movement of dollar
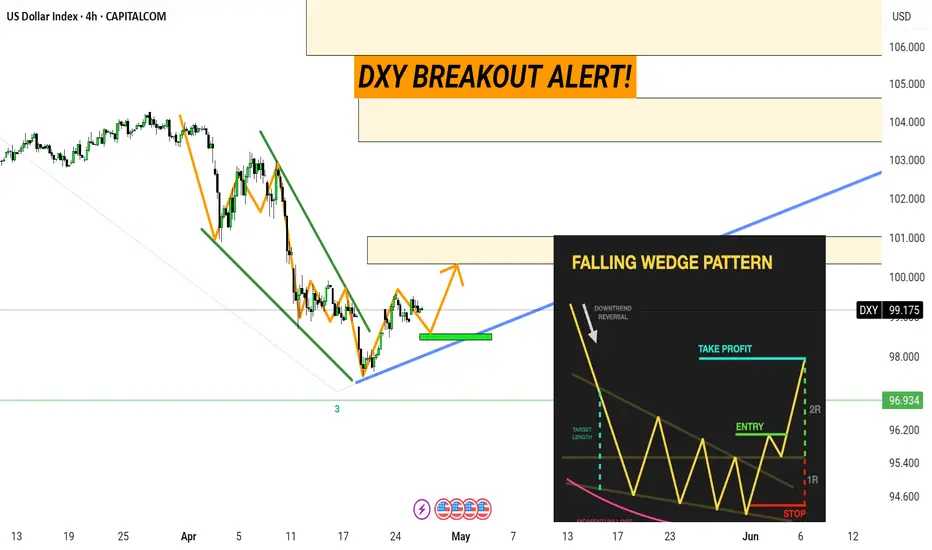
DXY BREAKOUT IN PLAY — Smart Money is Moving!After a clean falling wedge formation, DXY is showing early signs of bullish momentum.
Price action respects the trendline support + bullish orderblock (green zone) beautifully!
Next targets: 101.000 — 103.000 zone.
Watch for pullback entries before continuation.
This is textbook falling wedge breakout behavior — stay sharp!
Levels Marked:
Support: 99.00 zone
Target Zones: 101.000 & 103.000
Breaker structure: Confirmed bullish
Save this setup & be prepared!
Is this the start of a massive dollar rally? Learn how .Price action (falling wedge breakout)
Institutional concept (BOS – Break of Structure, 78.6% Fibonacci retracement entry zone)
Liquidity zones (4H LQ and key levels marked in green)
Higher targets (institutional supply zones highlighted in cream boxes around 104-107)

DXY Dxy has some more upside, let the market go above 100 and then we will see the reaction.
Disclosure: We are part of Trade Nation's Influencer program and receive a monthly fee for using their TradingView charts in our analysis.
