ENA Downtrend WeakeningWe are getting close to the invalidation level (all time low), but the downtrend is losing strength.
First bullish signal would be a break of the green descending channel.
Or, if you´re into YOLOing, begin building a position from current levels (high risk, since we don't have any bullish price ac
Related pairs

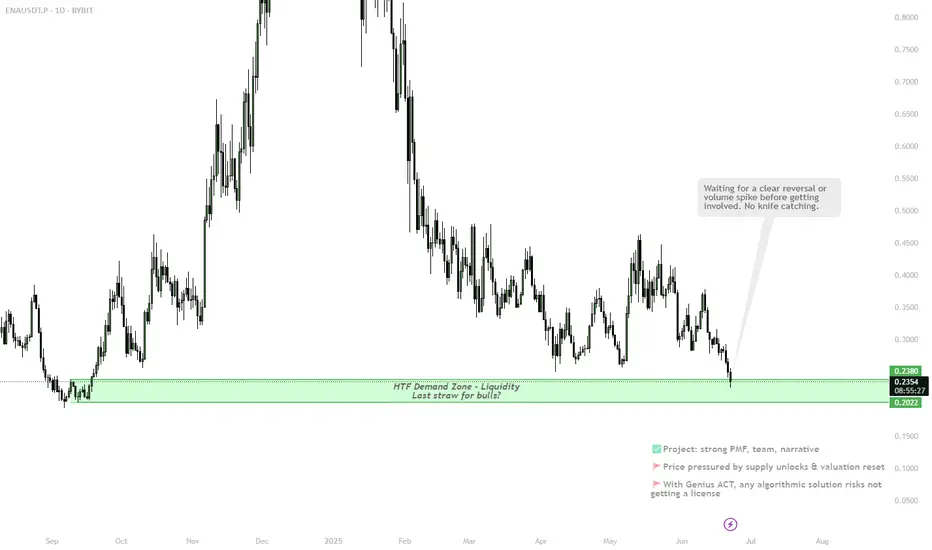
ENA At Make-or-Break Demand — Long-Term Thesis on the Line🎯 BINANCE:ENAUSDT Trading Plan:
Scenario 1 (Reversal from Demand):
Watch for strong reaction in demand zone ($0.24–$0.20)
Long-term entries on confirmation (H4/D1 SFP or reclaim above demand)
Scenario 2 (Breakdown):
No trade if $0.20 breaks with high volume/no bounce
Next demand much lower,
Phemex Analysis #91: Pro Tips for Trading Ethena (ENA)Launched in 2024, Ethena ( PHEMEX:ENAUSDT.P ) has swiftly risen as a powerful innovator in decentralized finance (DeFi). Its flagship synthetic dollar stablecoin, USDe, has achieved remarkable growth—ballooning from a mere $100 million supply at the beginning of 2024 to an impressive $5.8 billion,

ENAUSDT 1D Analysis ENA ~ 1D Analysis
#ENA Buy back gradually from here if you still have confidence in this coin with a short term target of at least 15%+ from here.

ENAUSDT Long / Buy SetupOn lower tf ena showing bullish momentum, while previous setups went bad due to war, but ena still holding the previous marked area, this is a short term setup not long term, still expecting another low for whole market. Will share swing setups if found strong momentum. Must use SL as btc as it's pe

ENA NEXT MOVE ?ENA/USDT is at a critical point. It's either poised for a breakout above 0.3030-0.3050 resistance (bullish) or a breakdown below the ascending trendline support (bearish). Volume and confirmed candle closes are key for conviction.

ENAPossible swing play
- in a consolidation range not a bad area to bid.
- new coin with good fundamental.

ENAUSDT Ascending Triangle Breakout – Long Setup in PlayThis chart displays a potential bullish breakout for ENAUSDT on a lower time frame, forming a classic ascending triangle pattern. The price has been making higher lows while repeatedly testing the horizontal resistance around $0.303, signaling increasing buying pressure.
A long position has been in

The high low weekly trading system performanceJust testing system to see that I actually have en edge

ENA About to Explode or Dump? Key Levels You Can’t Ignore!Yello Paradisers — are you positioned right for the next potential explosion in #ENA, or will you get caught on the wrong side of the move like most retail traders? After a brutal grind in a descending channel, something big is brewing... and it’s coming faster than many realize. Let's dive in.
💎#E

See all ideas
Summarizing what the indicators are suggesting.
Oscillators
Neutral
SellBuy
Strong sellStrong buy
Strong sellSellNeutralBuyStrong buy
Oscillators
Neutral
SellBuy
Strong sellStrong buy
Strong sellSellNeutralBuyStrong buy
Summary
Neutral
SellBuy
Strong sellStrong buy
Strong sellSellNeutralBuyStrong buy
Summary
Neutral
SellBuy
Strong sellStrong buy
Strong sellSellNeutralBuyStrong buy
Summary
Neutral
SellBuy
Strong sellStrong buy
Strong sellSellNeutralBuyStrong buy
Moving Averages
Neutral
SellBuy
Strong sellStrong buy
Strong sellSellNeutralBuyStrong buy
Moving Averages
Neutral
SellBuy
Strong sellStrong buy
Strong sellSellNeutralBuyStrong buy
Displays a symbol's price movements over previous years to identify recurring trends.
Frequently Asked Questions
The current price of ENA / USDT Spot Trading Pair (ENA) is 0.2707 USDT — it has risen 1.10% in the past 24 hours. Try placing this info into the context by checking out what coins are also gaining and losing at the moment and seeing ENA price chart.
ENA / USDT Spot Trading Pair price has risen by 7.21% over the last week, its month performance shows a −28.42% decrease, and as for the last year, ENA / USDT Spot Trading Pair has decreased by −44.53%. See more dynamics on ENA price chart.
Keep track of coins' changes with our Crypto Coins Heatmap.
Keep track of coins' changes with our Crypto Coins Heatmap.
ENA / USDT Spot Trading Pair (ENA) reached its highest price on Apr 11, 2024 — it amounted to 1.5270 USDT. Find more insights on the ENA price chart.
See the list of crypto gainers and choose what best fits your strategy.
See the list of crypto gainers and choose what best fits your strategy.
ENA / USDT Spot Trading Pair (ENA) reached the lowest price of 0.1920 USDT on Sep 6, 2024. View more ENA / USDT Spot Trading Pair dynamics on the price chart.
See the list of crypto losers to find unexpected opportunities.
See the list of crypto losers to find unexpected opportunities.
The safest choice when buying ENA is to go to a well-known crypto exchange. Some of the popular names are Binance, Coinbase, Kraken. But you'll have to find a reliable broker and create an account first. You can trade ENA right from TradingView charts — just choose a broker and connect to your account.
Crypto markets are famous for their volatility, so one should study all the available stats before adding crypto assets to their portfolio. Very often it's technical analysis that comes in handy. We prepared technical ratings for ENA / USDT Spot Trading Pair (ENA): today its technical analysis shows the sell signal, and according to the 1 week rating ENA shows the sell signal. And you'd better dig deeper and study 1 month rating too — it's neutral. Find inspiration in ENA / USDT Spot Trading Pair trading ideas and keep track of what's moving crypto markets with our crypto news feed.
ENA / USDT Spot Trading Pair (ENA) is just as reliable as any other crypto asset — this corner of the world market is highly volatile. Today, for instance, ENA / USDT Spot Trading Pair is estimated as 5.12% volatile. The only thing it means is that you must prepare and examine all available information before making a decision. And if you're not sure about ENA / USDT Spot Trading Pair, you can find more inspiration in our curated watchlists.
You can discuss ENA / USDT Spot Trading Pair (ENA) with other users in our public chats, Minds or in the comments to Ideas.