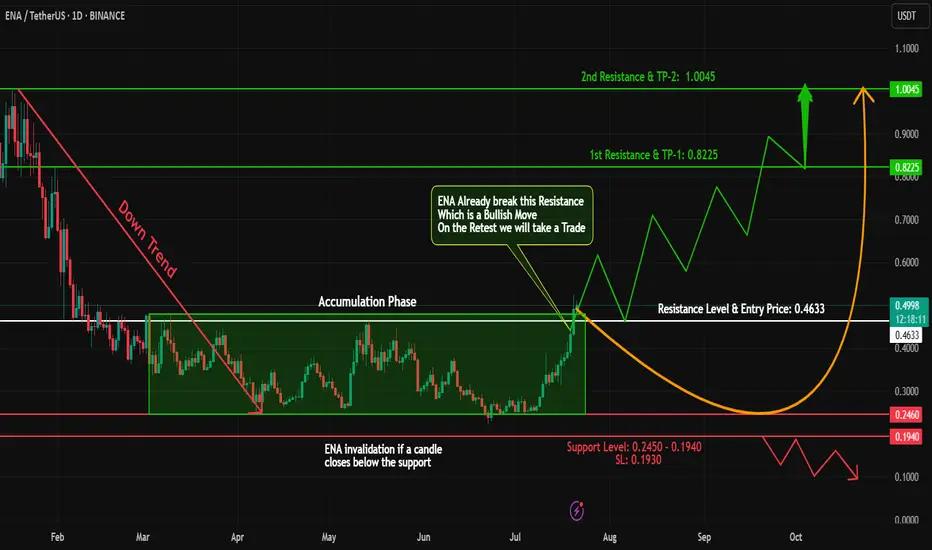
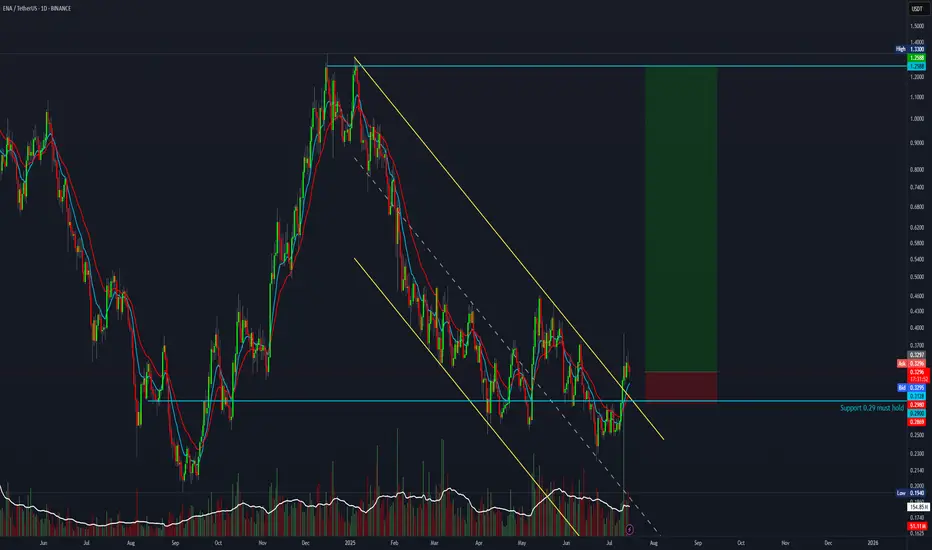
ENA Breakout Alert – Bullish Opportunity Ahead!#ENA has shown a classic accumulation + breakout structure!
🔹 Phase 1: Downtrend – From 1.00 to 0.25, #ENA went through a steep correction.
🔹 Phase 2: Accumulation – Price consolidated for a while, forming a strong base.
🔹 Phase 3: Breakout – #ENA has now closed a daily candle above the accumulation zone – a strong bullish signal!
📊 Trade Plan:
✅ Long Entry: At CMP or on a retest of the breakout zone
🎯 Targets: 0.80 - 1
🛡️ Stop Loss: Just below the accumulation zone
⚠️ Risk Management is key – stay smart and disciplined!
💬 What’s your take on #ENA’s next move? Share your thoughts below!
🧠 Follow for more breakout setups, trend analysis & educational content.
#ENA #CryptoBreakout #Accumulation #Altcoins #TradingView #CryptoAnalysis #TechnicalAnalysis #TrendReversal
ENAUSDT trade ideas
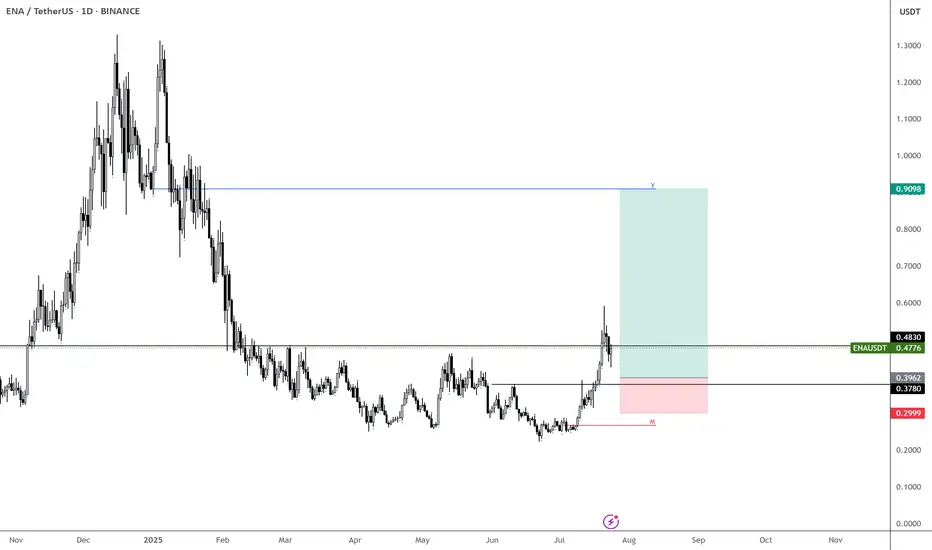
ENA – Sub-40c Would Be a Gift
If we get BINANCE:ENAUSDT below 40c, that would be an incredible opportunity.
Maybe I’m being too greedy—or maybe not. I’ll let the market decide.
Right now, ENA looks like a solid play for the coming weeks, so I’m focused on finding the best possible entry.
MARKETSCOM:ETHEREUM still looks strong overall. Even with a minor retrace, I’m expecting higher—potentially up to $7k.
So it makes sense to position in names like BINANCE:ENAUSDT , BINANCE:EIGENUSDT , BINANCE:AAVEUSDT , and others to ride the wave.
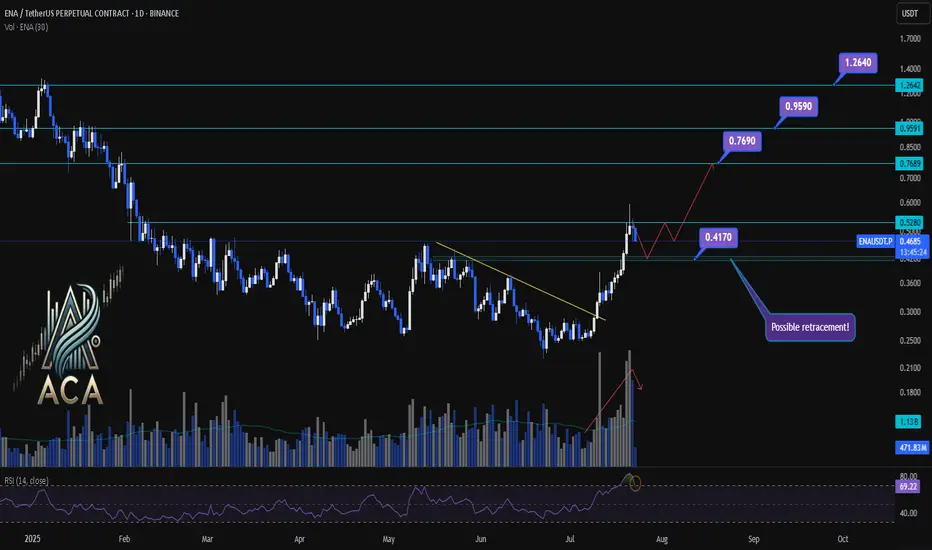
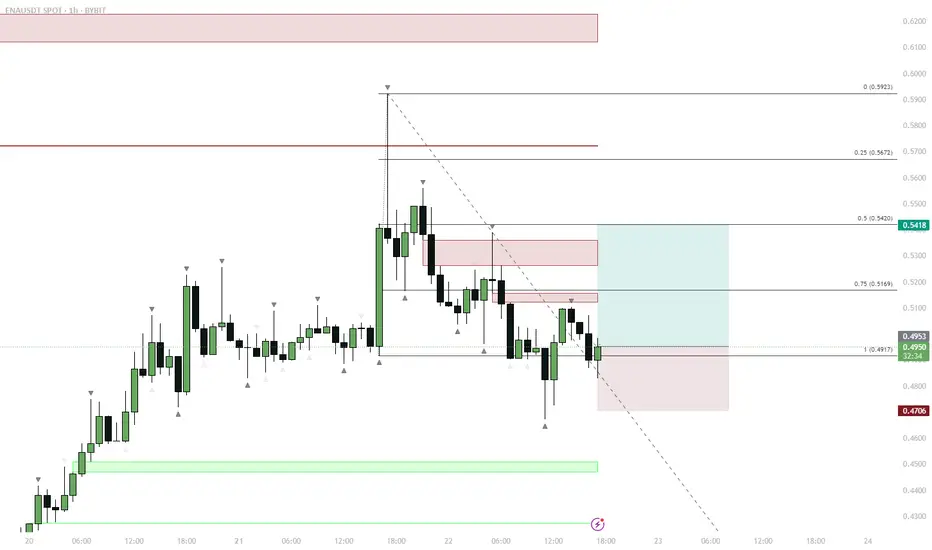
ENA/USDT Chart Analysis | Volatility Signals & Bullish TriggersENA/USDT Chart Analysis | Volatility Signals & Bullish Triggers
🔍 Let’s dive into the ENA/USDT perpetual contract and analyze recent price action, focusing on momentum shifts and key breakout scenarios.
⏳ Daily Overview
The daily chart shows that ENA recently reentered the overbought zone on the RSI, which can serve as a potential trigger for traders watching momentum shifts. Earlier, price action broke decisively above a long-standing descending trendline, resulting in a rapid, nearly 100% surge, a classic RR2 move off the trendline. This breakout coincided with a visible uptick in trading volume, confirming strong demand behind the move.
Now, during the ensuing rest or correction phase, trading volume is decreasing—often a constructive sign suggesting either profit-taking or a healthy pullback rather than panic selling.
🔺 Bullish Trigger & Setup:
- RSI Signal: Reentry into the RSI overbought zone is a potential long trigger, especially if confirmed by price action.
- Confirmation Level: A daily close with strong volume above $0.528 would add conviction to a bullish setup.
- Trendline Reference: The break above the recent trendline fueled the rapid advance, showing the importance of watching such key resistance levels.
📊 Key Targets (on further bullish confirmation):
- $0.769 — First upside resistance.
- $0.959 — Next bullish target.
- $1.264 — Extension target if momentum continues and broader market sentiment remains supportive.
🚨 Conclusion:
Eyes are on the $0.528 level—closing above it with volume, especially while RSI holds in the overbought zone, could provide the next strong entry signal. Current declining volume during pullbacks suggests this is likely a profit-taking phase or standard correction, not bearish capitulation. Keep monitoring RSI, volume profile, and price closes for the next actionable opportunity.
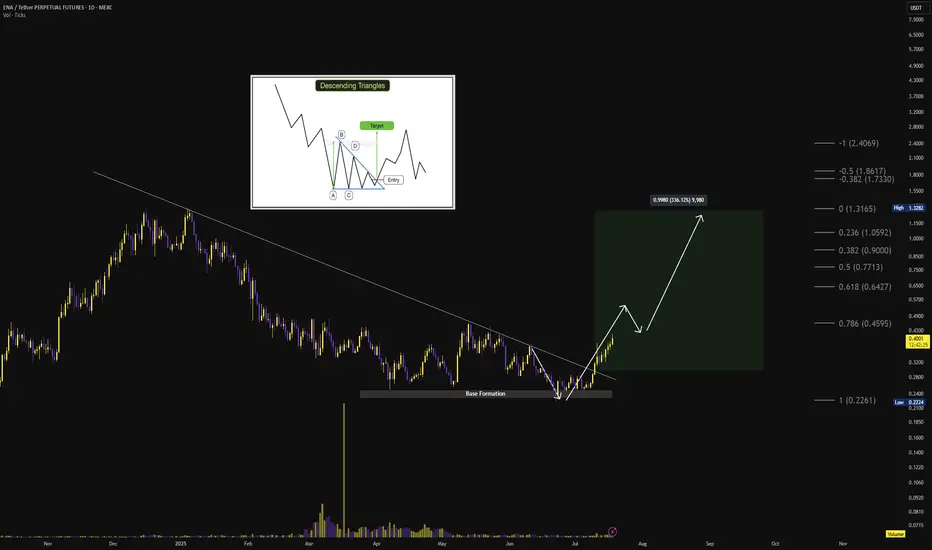
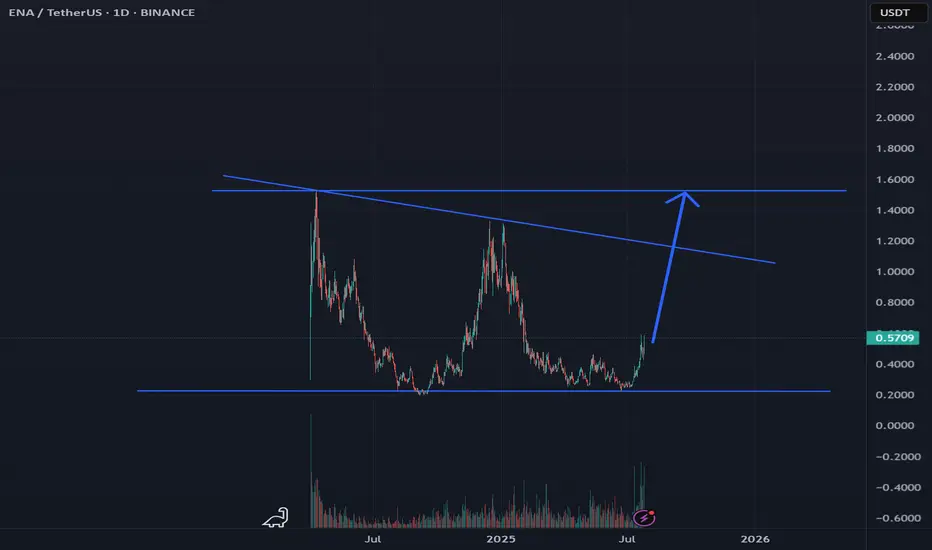
$ENA HTF Descending Triangle ReversalDescending triangle + 10-month base accumulation, breakout initiated above long-term diagonal resistance 🔻📈
Breakout Confirmation: ✅ Breakout confirmed above $0.30
🎯 Targets:
🟢 Short-term: $0.45
🟢 Mid-term: $0.64, $0.77, $0.90
🟢 Long-term: $1.05, $1.31, $1.73+
Momentum: Volume expansion validates breakout; price action suggests impulse wave forming with sustained higher lows
❌ Invalidation: Breakdown below $0.22 (Fib 1.0 level and base structure) 🔴
Ena scalp long to $0.3930 areaena scalp long
Stop: $0.3613 or lower
Tp: $0.3930
Potential early closure $0.3848

21:1 risk-to-reward trade setup for EthenaIs it time for the bulls to push it higher? This setup offers a 21:1 risk-to-reward ratio with a target of 1.25.
Entry 0.32
Stop loss 0.25
Target 1.25
ENA | Waiting for Trendline BreakENA is demonstrating strength by trading above its weekly SMA-10, indicating underlying bullish momentum.
Key Technical Levels:
Current resistance: Green descending trendline around $0.38
Critical pivot: $0.5140 level
Bullish Scenario:
A break above the descending trendline could trigger significant upside momentum toward the $0.94 resistance zone. The projected path (pink arrow) suggests potential for substantial gains once this key barrier is cleared.

ENA — Range Deviation & Reclaim: LTF Long Setup
ENA traded in a tight LTF range, then deviated below support, forming a sweep/liquidity grab.
Price quickly reclaimed the range low and retested the FVG (Fair Value Gap) below the range.
This reclaim/flip is a classic bullish reversal setup after a sweep.
Entry on the retest of FVG and previous support, targeting a move back to mid-range and then range highs.
Invalidation below the deviation low (stop).
Price action shows a textbook range deviation and reclaim setup. ENA swept liquidity below the range, trapped shorts, and reclaimed support, forming a bullish reversal signal. The retest of the FVG provided a high-probability entry for a move back to the range highs. This play relies on the principle that deviation and reclaim below a range often leads to a reversal as trapped sellers are forced to cover.
ENA Coin Forms a W Pattern: Reversal Potential GrowsOn the global chart of the ENA coin, a W pattern is forming, indicating a possible reversal and growth. It is worth noting that since the launch, the coin has not yet realized its full potential.
Current price: $0.56
If the pattern is realized, a movement to the $0.58 zone is expected and in the case of an increase in momentum to $0.73
Also, according to the structure of the pattern, a correction to the $0.43 region is possible before continuing the upward movement
This analysis is based on the technical pattern and also incorporates AI to provide more accurate results.
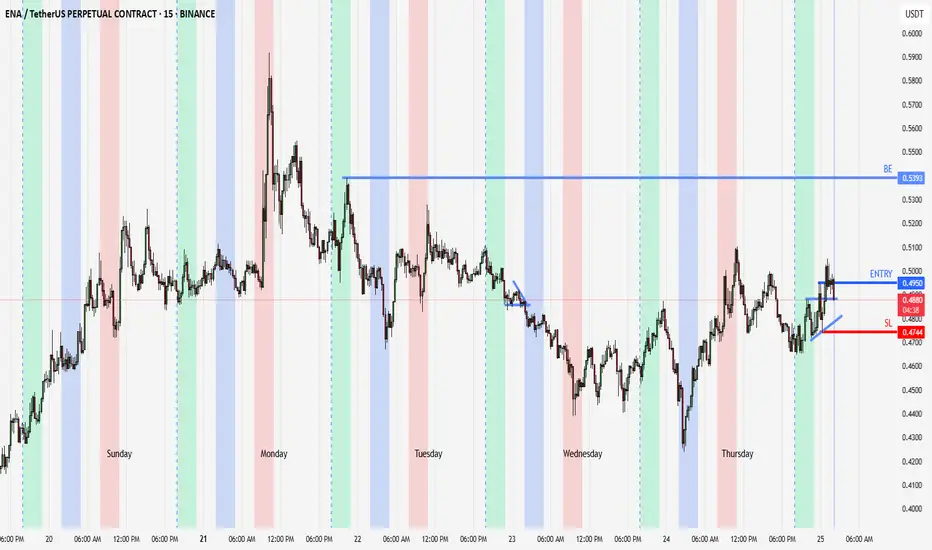
outside day setup50% pullback to the 200ma on the daily chart. looking for it to go to new high. after an outside day it crossed above the 200ma and 20ma on the 15min.made a acending triangle supported by the 20ma, breakout in the gaptime and now pulls back and giving an entry at the open of london. looking to hold till close. breakeven if it hit the breakeven target
ENA Swing planENA swing plan explained in the chart.
Strategy: Supply and Demand.
Higher Time frame confirmations needed before entering.
Scaled entries would be preffered.

ENA — Buy Reload Below $0.30 | #1D | BULLISH1. Take profits at mid-range resistance ($0.35–0.46)
2. Set limit order for reload in $0.25–0.30 zone
3. Stop below $0.22
4. Alert on retest of $0.35

Ena move fast Ethena
Ethena is a blockchain-based protocol on Ethereum designed to create a decentralized, crypto-native stablecoin called USDe.
Everything is clear on the chart.
It's time to fly.
I wish everyone abundant profits.
Like and follow
for more.

ENAUSDTAccording to TRex, the price has made a sharp downward move. I expect a triple drive, which has turned two-sided and is expecting a third drive.

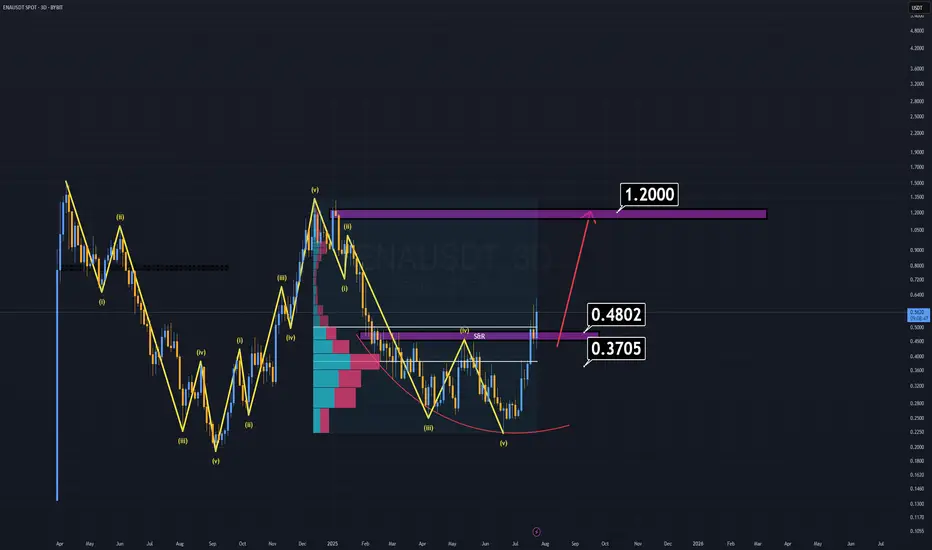
ENA Analysis (3D)ENA has been outperforming many altcoins for weeks, yet it still appears undervalued based on its fundamentals and recent investor interest.
Where to buy?
Right now, buying at current levels is extremely risky, as the ideal buy-back zones are significantly below the market price.
First major support: $0.48 — considered a "cheap" entry.
Dream entry (low probability): $0.37–$0.38 — at that point, ENA would feel almost free.
Notably, BlackRock and its partners are actively investing in ENA, which speaks volumes about its long-term credibility. That alone justifies keeping it on your radar.
Minimum target: $1.00–$1.20
Remember, that’s just the beginning. We may see even more once momentum kicks in.
Sometimes, the best trade is the one you're waiting for.
Good luck.
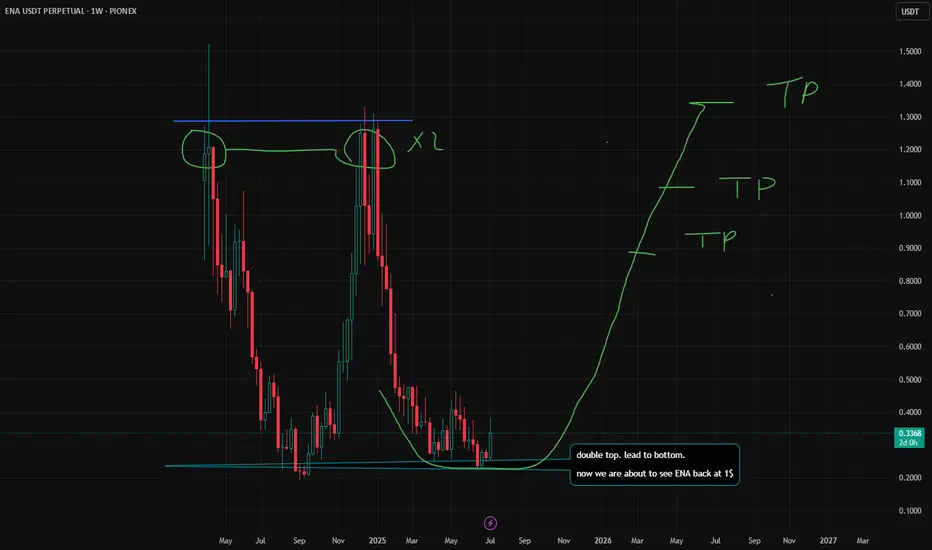
ENA / USDT LONGSafe liquidation prices. and long to the 1 dollar range yet again for ENA. BITCOIN looks strong. the rsi and macd look healthy and the global m2 chart is realistically following the same pursuit and has not pulled back yet!
we are looking at a very nice alt season to come. DONT let anyone fool you. this is the bullrun incoming and BTC is not done yet.
follow me for more alpha; for the future. and dont forget to leave a ROCKET
Buy Trade Strategy for ENA: Backing the Ethena Protocol VisionDescription:
This trading idea is based on ENA, the native token of the Ethena Protocol, a rising star in the decentralized finance (DeFi) space aiming to build a crypto-native, yield-bearing stablecoin alternative called USDe. ENA plays a critical role in governance, staking, and incentivizing ecosystem participants. Ethena’s innovative architecture, which combines delta-neutral strategies with Ethereum-based infrastructure, has drawn significant interest from both institutional and retail users. With growing adoption, strong investor backing, and real-world use cases, ENA is positioned as a key asset for those looking to gain exposure to next-generation DeFi protocols focused on scalability and stability.
That said, the crypto market is known for its volatility. Factors such as regulatory uncertainty, market sentiment, and ecosystem risks can dramatically influence price action. Investors should consider these dynamics when planning their trades and ensure proper risk management is in place.
Disclaimer:
This trading idea is for educational purposes only and does not constitute financial advice. Trading cryptocurrencies, including ENA, involves substantial risk and can result in the loss of your entire investment. Always perform thorough research, assess your personal financial situation, and consult with a qualified financial advisor before making any investment decisions. Past performance is not indicative of future results.

ENA/USDT – Compression Break Imminent?Market forming a clean falling wedge, typically bullish.
We’re at the upper boundary now, looking for a clean breakout and retest.
Volume rising could confirm the move.
Watch levels:
Breakout trigger: 0.32
Target: 0.42
Invalid if it dumps below 0.27
Want more of these setups? Hit follow & I’ll keep them coming.

Trading plan for ENAThis week, price has been attempting to break through the pivot point but has faced consistent rejection. We may see a retest of the local high, and if price reverses back below the pivot, the next target would be the support zone
Trade safe and stay adaptive!

ENA/USDT Breakout Watch Signs of Reversal from a Key Demand Zone🔍 Full Technical Analysis:
ENA/USDT has been forming a Descending Triangle pattern since the December 2024 high — a structure often seen in continuation moves, but here it may act as a potential reversal pattern, especially since price is consolidating around a strong historical demand zone.
The price is hovering within a key support area between $0.1940–$0.2624, which has repeatedly held against bearish pressure. Recent candles are showing signs of accumulation, indicating possible base formation before a breakout.
✅ Bullish Scenario (Breakout Setup):
If the price successfully:
1. Breaks above the descending trendline (yellow line), and
2. Confirms with a breakout above the $0.28–$0.30 zone with strong volume,
We could see a powerful bullish reversal with the following upside targets:
📈 Target 1: $0.3720
📈 Target 2: $0.4569 – breakout structure confirmation
📈 Target 3: $0.6540 – prior resistance zone
📈 Target 4: $0.7702
📈 Target 5: $0.8928
💥 Extended Targets: $1.2512 – $1.3300 (Major High from December 2024)
🚨 A clean breakout from this setup may trigger major FOMO and offer multi-level swing trading opportunities.
❌ Bearish Scenario (Breakdown Risk):
If the downtrend continues and:
The price fails to break above the trendline, and
Breaks below $0.1940, which is the historical low support,
Then the door opens for further downside towards: 🔻 Bearish Target: $0.1600 or lower
⚠️ A confirmed breakdown below this key zone would suggest trend continuation and weakness in buyer interest.
🧠 Strategic Summary:
Strong Demand Zone + Historical Support suggest high probability of trend reversal.
Descending Triangle offers a textbook breakout opportunity with favorable risk-reward.
High RR potential makes this setup ideal for swing traders and mid-term investors.
💡 Success tip: Wait for breakout confirmation and volume spike before entering.
#ENAUSDT #CryptoBreakout #DescendingTriangle #BullishReversal #AltcoinSetup #CryptoTrading #SwingTrade #TechnicalAnalysis #ChartPatterns #SupportAndResistance

$ena A Pattern - UP? ENA
Potentially forming an accumulation phrase.
Wait for a breakout with volume.
SPOT first.

ENAUSDTENA/USDT – 1H Analysis (July 7, 2025)
Structure:
Price formed a rising wedge, already broke down.
Currently retesting 0.2630–0.2640 zone.
Scenarios:
Bearish: If rejected, target is 0.2540–0.2555.
Bullish: If price reclaims 0.2650, may go to 0.2700.
Indicator:
Stochastic is falling, confirming bearish pressure.

ENA : The largest token release...Hello dears
Given the long-term price decline that we have witnessed, it has now been announced that this currency is going to do a token release, which will naturally cause the price to fall, so be careful.
In case of a fall, we have identified important supports for you so that you can buy with risk and capital management.
The target has also been identified.
*Trade safely with us*
