ENA...Hello friends
Given that the price has reached the bottom of the range, which is also a good support area, we can enter the trade with risk and capital management.
*Trade safely with us*
ENAUSDT trade ideas

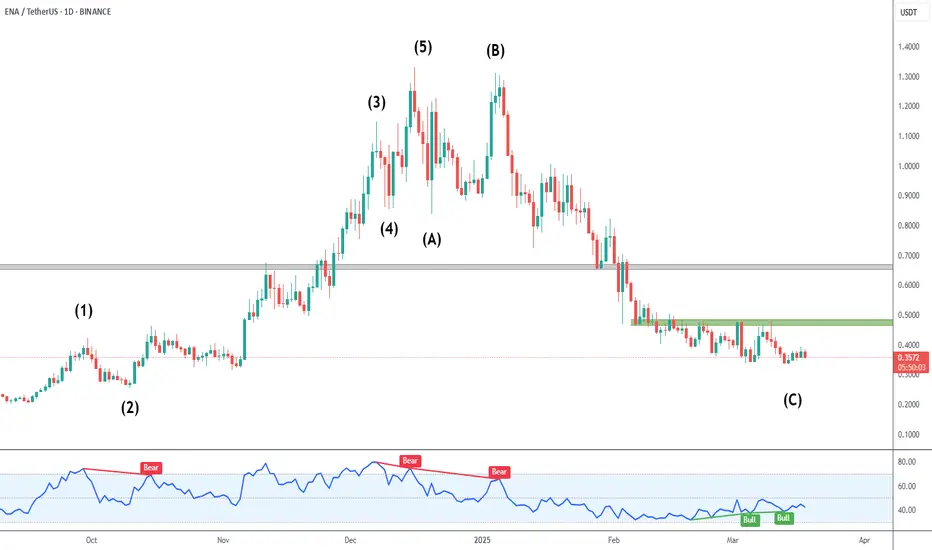
ENA DivergenceThe downtrend is losing strength, and we could be near the end of black C.
RSI divergence has been present for the last month.
A break of green resistance is a bullish signal.
Gray resistance is a major hurdle for a continued upside.
Phemex Analysis #68: Is It A Good Time to Buy Ethena (ENA) Now?!Ethena has rapidly ascended in the decentralized finance (DeFi) sector, notably propelling its stablecoin, USDe, to become the world's largest by market capitalization within a year. In December 2024, Ethena Labs introduced USDtB, a stablecoin backed by BlackRock's tokenized money market fund, BUIDL, aimed at stabilizing USDe during bearish crypto market phases. More recently, a proposal has been put forward to integrate Ethereal, a decentralized exchange (DEX), into Ethena's reserve management system. This integration seeks to enhance trading capabilities for USDe and distribute governance tokens to ENA holders, further enriching the ecosystem.
Despite these fundamental advancements, ENA's price has experienced significant volatility. After reaching a high of $1.32, the token's value declined by approximately 75%, hitting a low of $0.33. However, the downward momentum has recently slowed, coinciding with a broader market recovery. This shift has led many to question whether now is an opportune time to invest in ENA, especially considering its substantial real-world developments.
Potential Scenarios
1. Continued Downtrend
If ENA fails to maintain current support levels at $0.316, it could test lower price points. Factors such as broader market downturns or negative investor sentiment could exacerbate this decline.
Pro Tips:
Short Positions: Experienced traders might consider short-selling strategies to capitalize on potential declines, especially if the price drops below $0.316 with high volume.
Buying at Support Levels: Long-term investors may consider accumulating ENA gradually near established support levels such as $0.26 and $0.20.
2. Consolidation Phase
ENA may enter a consolidation phase, trading within a defined range as the market seeks direction. This period of sideways movement could last until new catalysts emerge.
Pro Tips:
Range Trading: Identify key support ($0.316) and resistance levels ($0.48) to execute buy and sell orders effectively within the trading range.
Patience: Avoid overtrading during consolidation; wait for clear signals before making significant moves.
3. Bullish Reversal
Given ENA's recent positive developments and technical indicators, there is potential for a bullish reversal. Sustaining levels above recent resistance points could signal renewed investor confidence and an upward trend.
Pro Tips:
Breakout Entry: If the price breaks above the $0.40 resistance level with high volume, consider a long position with profit targets at $0.48, $0.54, and $0.70.
Accumulate Gradually: Consider dollar-cost averaging to build a position without exposing yourself to immediate market volatility.
Conclusion
Deciding to invest in ENA requires careful consideration of these scenarios. By employing strategic approaches tailored to each potential outcome, traders can better navigate the complexities of the cryptocurrency market. As always, thorough research and prudent risk management are essential when making investment decisions.
Tips:
🔥 Break free from "buy low, sell high"! Our new Pilot Contract empowers you to profit from ANY market direction on DEX coins with up to 3x leverage. Go long, go short, go further!
Check out Phemex - Pilot Contract today!
Disclaimer: This is NOT financial or investment advice. Please conduct your own research (DYOR). Phemex is not responsible, directly or indirectly, for any damage or loss incurred or claimed to be caused by or in association with the use of or reliance on any content, goods, or services mentioned in this article.

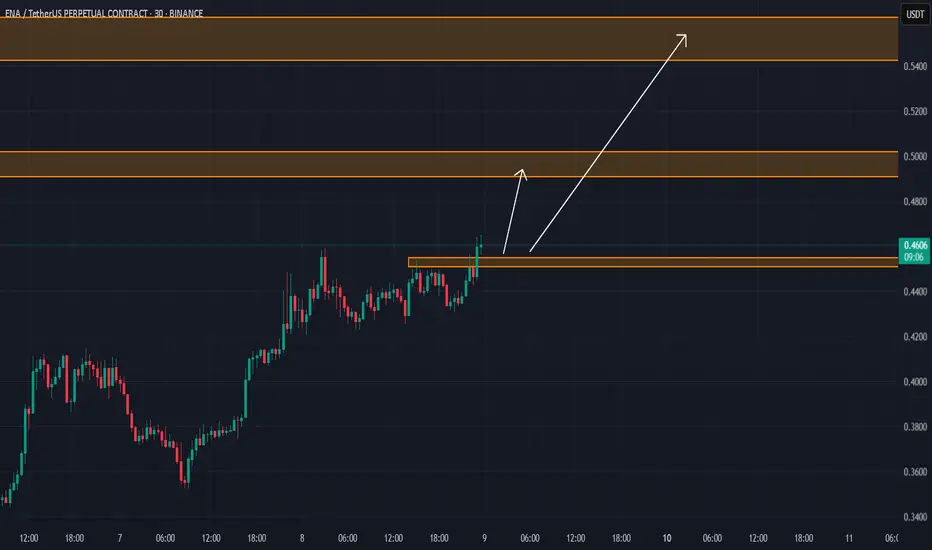
$ENA LTF Resistance to FlipENA | 4H
If we can flip its local resistance $0.40, we can see it pulls back up retesting the equilibrium $0.47 to $0.52
Local support is around $0.35-$0.32

ENA/USDT 4H: Bullish Divergence & Channel Breakout – Strong Buy Ethena (ENA/USDT) is showing a compelling buy opportunity on the 4-hour timeframe. A clear bullish divergence has formed on the RSI, indicating weakening selling momentum and a potential trend reversal. Additionally, price has successfully broken out of a descending channel, confirming a shift in market structure.
With the bullish divergence and channel breakout, ENA is poised for further upside. Consider entering long positions with a stop-loss below the recent swing low. Let’s ride the wave! 🚀
#Ethena #ENA #BullishDivergence #Breakout #Crypto
Feel free to adjust the support and resistance levels based on your analysis!

TradeCityPro | ENAUSDT Ready to Go!👋 Welcome to the TradeCityPro channel!
Let's go together to analyze and review one of my favorite coins and DeFi coins that we are likely to have and experience a movement in the coming days
🌐 Overview Bitcoin
Before starting the analysis, I want to remind you again that we moved the Bitcoin analysis section from the analysis section to a separate analysis at your request, so that we can discuss the status of Bitcoin in more detail every day and analyze its charts and dominances together.
This is the general analysis of Bitcoin dominance, which we promised you in the analysis to analyze separately and analyze it for you in longer time frames.
📊 Weekly Timeframe
On the weekly time frame, after we hit the 1.2788 level, which was our ATH, we got rejected from it and engulfed the previous weekly candle.
This was also an exit point or a take profit for us, and after this, it is very logical to withdraw some of our capital, and the reason is that the buyers could not do anything and push the price above this level!
📈 Daily Timeframe
On the daily time frame, but after we followed a parabolic move and its slope reached the end of the road, we were rejected by the important resistance of 1.2788
This rejection caused our parabolic move to end and after its failure, we went for an upward move again, but we were rejected by the resistance and went for the support of 0.7857
After the failure of this support and the pullback to it, we went for a rejection again from this resistance and are currently suffering between 0.3282 and 0.4833, with the difference that there is still more presence of sellers for this event
To buy at risk, you can also make a long position at risk after the level of 0.4833 because we can only be active in DeFi and take our coins to DeFi. Now that we are talking about DeFi, you can in this space Also set the liquidity range of the money and we can exit to activate the spot below the level of 0.3282!
📝 Final Thoughts
Stay calm, trade wisely, and let's capture the market's best opportunities!
This analysis reflects our opinions and is not financial advice.
Share your thoughts in the comments, and don’t forget to share this analysis with your friends! ❤️

ENA - It was a nice trade :)ENA Signal/TA was given to my friends/group.
I wrote : "retest/breakout trade"
What a nice short 🙂
13 % 👌 🎯
(i forget some of my TA to publish here :/ )
Follow for more ideas/Signals. 💲
Look at my other ideas 😉
Just donate some of your profit to Animal rights and rescue or other charity :)✌️

ENA Breaks Downtrend – Is a Rally Incoming?$ENA/USDT 12H chart shows a breakout above the resistance trendline and the 50 EMA, indicating a potential trend reversal. However, the price is currently facing resistance near the previous support-turned-resistance zone.
A retest of the trendline breakout is possible before further upside. If the price holds above the trendline and reclaims support, it could confirm a bullish continuation.
However, failure to hold may result in a fakeout and further downside.
DYOR, NFA

ENA/USDT Technical Analysis
🔹 Overview:
#ENA is retesting a major support level at $0.2049, which previously acted as a strong demand zone. The price is showing signs of a potential double bottom pattern, suggesting a bullish reversal could be forming.
🏹 Key Levels:
Support Zone: $0.2049 (potential reversal area)
Resistance Levels: $0.50, $0.75, and $1.00
💬Potential Targets:
Target 1 (T1): $0.75
Target 2 (T2): $1.00
Target 3 (T3): $1.50

Bullish Div & Double Bottom on ENABullish Divergence and Double Bottom pattern observed on ENA in the 4-hour time frame, indicating a potential trend reversal and upward movement

ENA / USDT (4hr) - Possible move higherIf we get two 4hr candle closes above 0.47, probability is for a move higher. Three suggested take profit levels and a 12% SL.

ENA/USDTKey Level Zone: 0.4510 - 0.4550
HMT v6 detected. The setup looks promising, supported by a previous upward/downward trend with increasing volume and momentum, presenting an excellent reward-to-risk opportunity.
HMT (High Momentum Trending):
HMT is based on trend, momentum, volume, and market structure across multiple timeframes. It highlights setups with strong potential for upward movement and higher rewards.
Whenever I spot a signal for my own trading, I’ll share it. Please note that conducting a comprehensive analysis on a single timeframe chart can be quite challenging and sometimes confusing. I appreciate your understanding of the effort involved.
Important Note :
Role of Key Levels:
- These zones are critical for analyzing price trends. If the key level zone holds, the price may continue trending in the expected direction. However, momentum may increase or decrease based on subsequent patterns.
- Breakouts: If the key level zone breaks, it signals a stop-out. For reversal traders, this presents an opportunity to consider switching direction, as the price often retests these zones, which may act as strong support-turned-resistance (or vice versa).
My Trading Rules
Risk Management
- Maximum risk per trade: 2.5%.
- Leverage: 5x.
Exit Strategy
Profit-Taking:
- Sell at least 70% on the 3rd wave up (LTF Wave 5).
- Typically, sell 50% during a high-volume spike.
- Adjust stop-loss to breakeven once the trade achieves a 1.5:1 reward-to-risk ratio.
- If the market shows signs of losing momentum or divergence, ill will exit at breakeven.
The market is highly dynamic and constantly changing. HMT signals and target profit (TP) levels are based on the current price and movement, but market conditions can shift instantly, so it is crucial to remain adaptable and follow the market's movement.
If you find this signal/analysis meaningful, kindly like and share it.
Thank you for your support~
Sharing this with love!
HMT v2.0:
- Major update to the Momentum indicator
- Reduced false signals from inaccurate momentum detection
- New screener with improved accuracy and fewer signals
HMT v3.0:
- Added liquidity factor to enhance trend continuation
- Improved potential for momentum-based plays
- Increased winning probability by reducing entries during peaks
HMT v3.1:
- Enhanced entry confirmation for improved reward-to-risk ratios
HMT v4.0:
- Incorporated buying and selling pressure in lower timeframes to enhance the probability of trending moves while optimizing entry timing and scaling
HMT v4.1:
- Enhanced take-profit (TP) target by incorporating market structure analysis
HMT v5 :
Date: 23/01/2025
- Refined wave analysis for trending conditions
- Incorporated lower timeframe (LTF) momentum to strengthen trend reliability
- Re-aligned and re-balanced entry conditions for improved accuracy
HMT v6 :
Date : 15/02/2025
- Integrated strong accumulation activity into in-depth wave analysis

ENA Long Reasons for the ENA Trade 🚀
1️⃣ EMA Alignment & Expansion – All EMAs are bullishly aligned and fanning out, signaling strong momentum and trend continuation.
2️⃣ EMA Golden Cross – A classic bullish signal where the shorter-term EMA crosses above the longer-term EMA, confirming upward strength.
3️⃣ Multiple Support Reclaims – ENA has successfully reclaimed 4 major support levels since the recent low:
3 horizontal levels
1 macro trendline from the ENA all-time low (ATL) on Sept 5th
4️⃣ Consistent Higher Lows & Highs – The market structure is firmly bullish with 3 consecutive higher lows & higher highs, indicating continued strength.
5️⃣ Strong Demand Zones –
First demand zone at the initial entry point (0.4175)
Second demand zone at the DCA level (0.3828)
6️⃣ Stop Loss (SL) Positioned Safely – Even the compounding trade has an SL below all 4 support levels and both demand zones, reducing downside risk.
📉 What Needs to Happen for This Trade to Invalidate?
For ENA to break down, it would need to:
Clear both demand zones
Break back below all 4 support levels
Lose the new trendline from the lows
Form a CHoCH (Change of Character) by printing a lower low
Conclusion:
The trade is highly structured with confluence, and the risk is well-managed with an SL below all key levels. Bulls remain in control unless a major breakdown occurs.

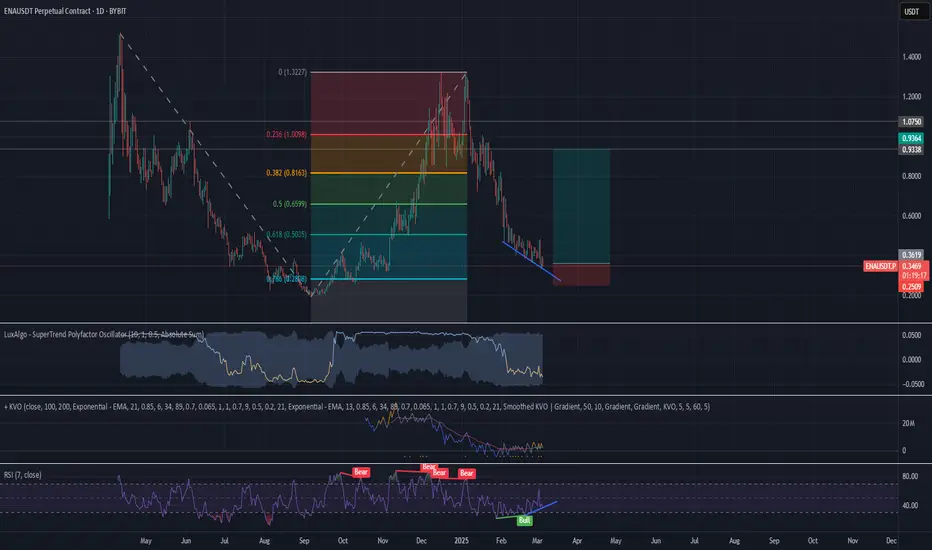
Breaking: Ethena ($ENA) Surged 21% Today- What Next?The synthetic dollar protocol built on Ethereum that will provide a crypto-native solution for money that is not reliant on traditional banking system infrastructure, alongside a globally accessible dollar-denominated savings instrument native token Ethena ( MIL:ENA ), saw its price surge by a whooping 21% today amidst the three white crow pattern that appeared on the daily price chart hinting at increased buying pressure.
Ethena, weeks back was down losing almost half of value, bulls took advantage of the dip and capitalize on the oversold nature of MIL:ENA , presently placing the RSI at 58 which is neither overbought nor oversold but hints at a continuous buying pressure.
In the case of a market pull back, MIL:ENA might find support in the 78.6% fib retracement level, similarly, a break above the 1-month high could pave way for a new resistance point with massive influx of buyers in the long term.
Ethena Price Live Data
The live Ethena price today is $0.439498 USD with a 24-hour trading volume of $758,695,169 USD. We update our ENA to USD price in real-time. Ethena is up 16.02% in the last 24 hours, with a live market cap of $1,416,695,330 USD. It has a circulating supply of 3,223,437,500 ENA coins and the max. supply is not available.

Ethena Getting Closer To Bullish BreakoutThis is a short-term chart setup for Ethena (ENAUSDT). Support is being tested and this can lead to a higher low. A higher low can lead to the resumption of the bullish trend. The bullish trend started with the early September 2024 low.
Volume is good. The way the candles are becoming stronger as the action enters the support zone is also a bullish signal. The consolidation is similar to mid-October/late November 2024.
I am sure we will see a price advance next. This is short-term, but the action can easily go beyond all targets shown on the chart. There will be strong bullish action later this month and even stronger in April and May, that's why the targets will be easy to conquer.
We are witnessing the calm before a bullish storm. The bearish action is over and was really strong. ENAUSDT was bearish between December 2024 and March 2025. It is time for some change.
Thank you for reading.
Enjoy the profits as they come.
We are getting closer by the hour...
Namaste.

ENAUSDT 2DENA ~ 2D Analysis
#ENA Buy gradually from here if you still have a Conviction on this Coin with a minimum target of 20%+.

ENAhello dear friends, as we have seen recently the market was brutally manipulated and unfortunately lots of ppl lost maybe everything.
regarding Ena, i have visualized how it will go in upcoming days.
good luck and be careful
god bless you
nfa

Mega trade opportunity on ENA Potential bullish reversal with a developing bullish divergence on both the 4-hour and daily timeframes.
The price is approaching a critical support level, which has held previously. This zone aligns with the bullish divergence, further adding to the likelihood of a bounce.
If we take trend base fib from previous peaks and bottom, we are right inside the golden pocket.
$ENA D1 Chart IdeaEthena's price has the potential to surge to around $0.80 in the near future, provided market conditions remain favorable. The upcoming Crypto Summit on March 7 could be a major catalyst for this move, but it's difficult to predict with certainty due to the recent volatility in the market. Nonetheless, let's see how Ethena's price action unfolds.
May the trading Gods be with you. 🤲🤲

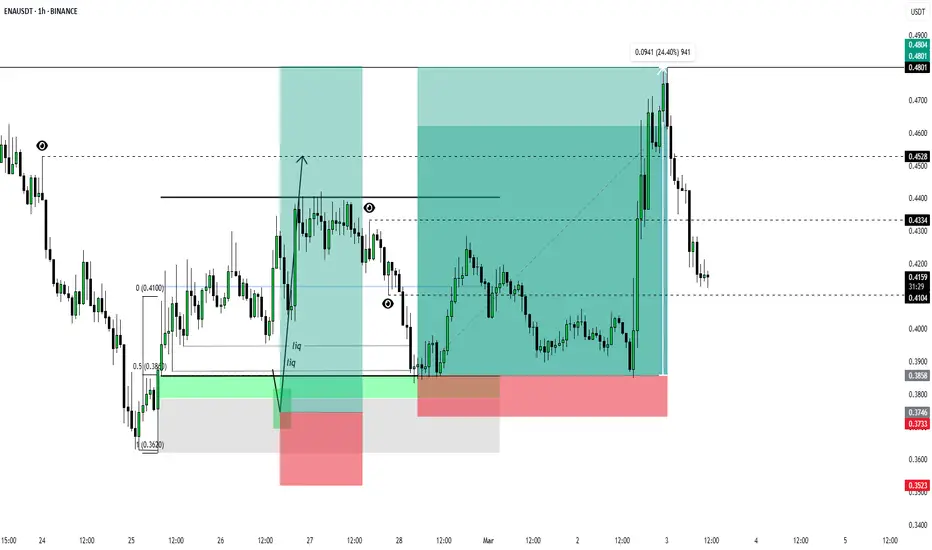
ENAUSDT 1H LONG (All Tsrgets Done)ENA LONG performed excellently according to all expectations and met all target marks from the provided review
Congratulations to everyone who took part in this position.
Basic review:
Update:
ENA Rebuy Setup (1D)The ENA structure has been bearish for a while. Given its significant drop and the upcoming support zones, we have identified two potential entry points for this asset. The target is marked on the chart.
A daily candle closing below the invalidation level will invalidate this analysis.
Do not enter the position without capital management and stop setting
Comment if you have any questions
thank you

$ENAUSDT | Potential Spot Entry #1D📌 Current Situation:
The price has reached the 1D OB cluster, a key support zone at $0.38 - $0.325.
A local level has formed, and LTF structure suggests a potential bottom.
🎯 Trading Plan:
🔹 Buy Zone: $0.38 - $0.325 – a critical support area.
🔹 Targets: First resistance at $0.65, with a possible retest and pullback in March.
🔹 Stop-Loss: Below $0.325 – a breakdown of this level invalidates the scenario.
📈 Justification:
✅ 1D OB Cluster: A strong demand zone with notable buyer activity.
✅ Potential Rebound to $0.65: A classic consolidation phase before a trend movement.
✅ Technical Structure: A tightening range is forming, suggesting an accumulation phase.
💡 Conclusion:
BINANCE:ENAUSDT looks promising for a spot entry, but a potential retest of the lows should be considered. Current levels offer an optimal risk/reward setup, but confirmation of a reversal is essential before entering.
