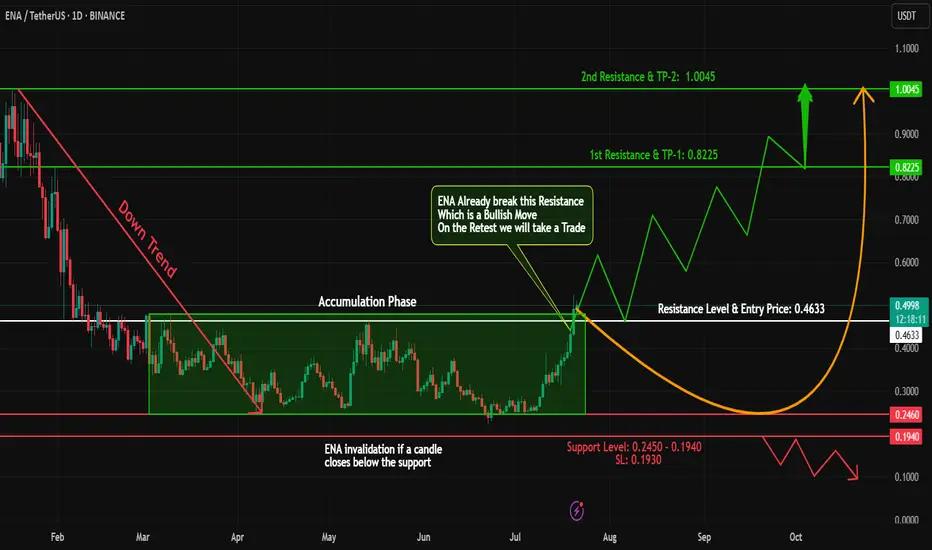
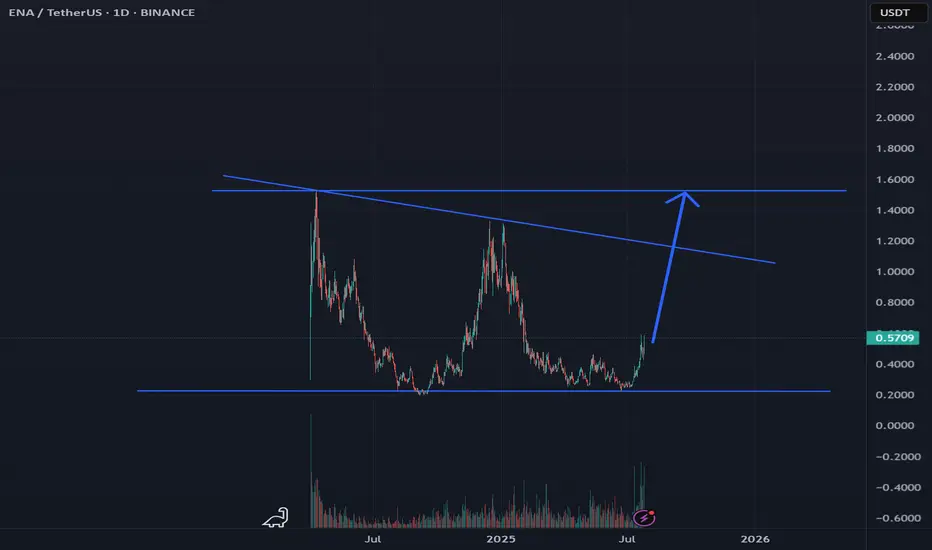
ENA Breakout Alert – Bullish Opportunity Ahead!#ENA has shown a classic accumulation + breakout structure!
🔹 Phase 1: Downtrend – From 1.00 to 0.25, #ENA went through a steep correction.
🔹 Phase 2: Accumulation – Price consolidated for a while, forming a strong base.
🔹 Phase 3: Breakout – #ENA has now closed a daily candle above the accumulatio
Related pairs
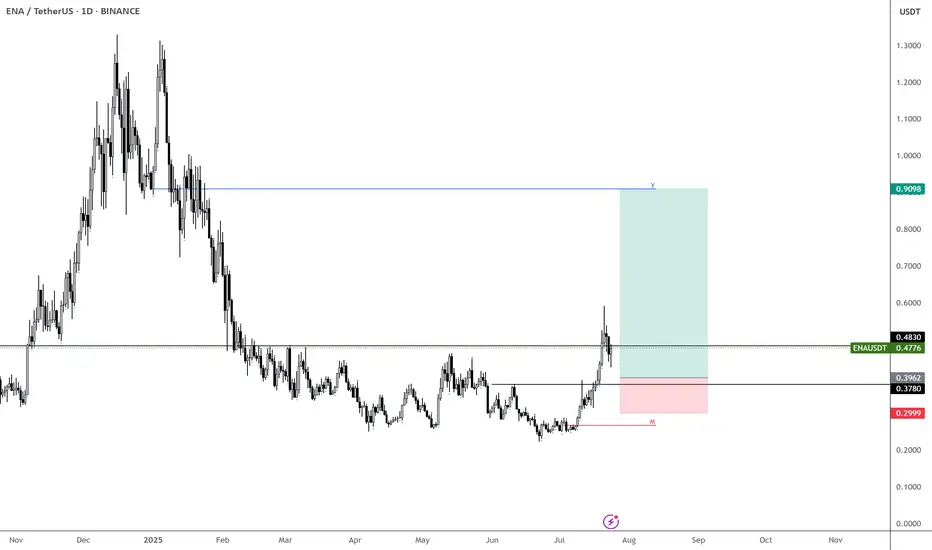
ENA – Sub-40c Would Be a Gift
If we get BINANCE:ENAUSDT below 40c, that would be an incredible opportunity.
Maybe I’m being too greedy—or maybe not. I’ll let the market decide.
Right now, ENA looks like a solid play for the coming weeks, so I’m focused on finding the best possible entry.
MARKETSCOM:ETHEREUM still looks
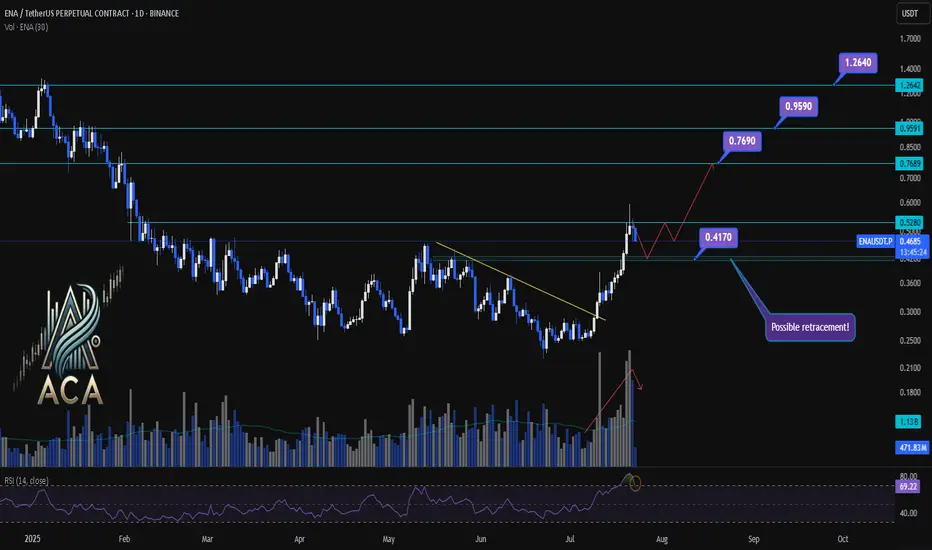
ENA/USDT Chart Analysis | Volatility Signals & Bullish TriggersENA/USDT Chart Analysis | Volatility Signals & Bullish Triggers
🔍 Let’s dive into the ENA/USDT perpetual contract and analyze recent price action, focusing on momentum shifts and key breakout scenarios.
⏳ Daily Overview
The daily chart shows that ENA recently reentered the overbought zone on the
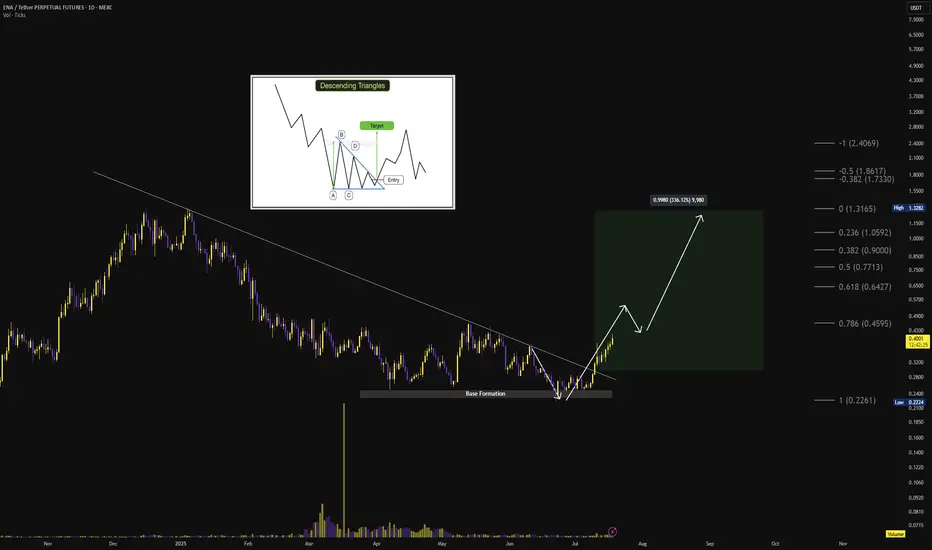
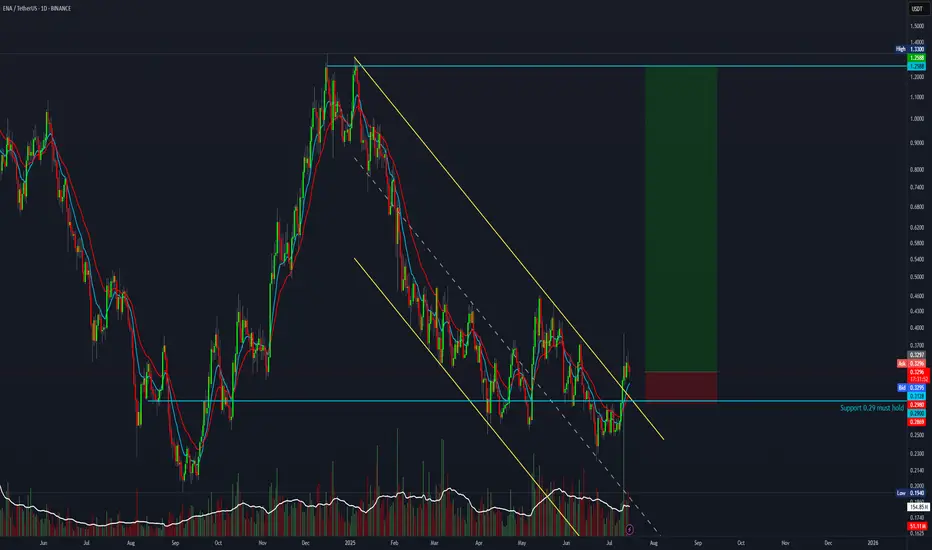
$ENA HTF Descending Triangle ReversalDescending triangle + 10-month base accumulation, breakout initiated above long-term diagonal resistance 🔻📈
Breakout Confirmation: ✅ Breakout confirmed above $0.30
🎯 Targets:
🟢 Short-term: $0.45
🟢 Mid-term: $0.64, $0.77, $0.90
🟢 Long-term: $1.05, $1.31, $1.73+
Momentum: Volume expansion validate
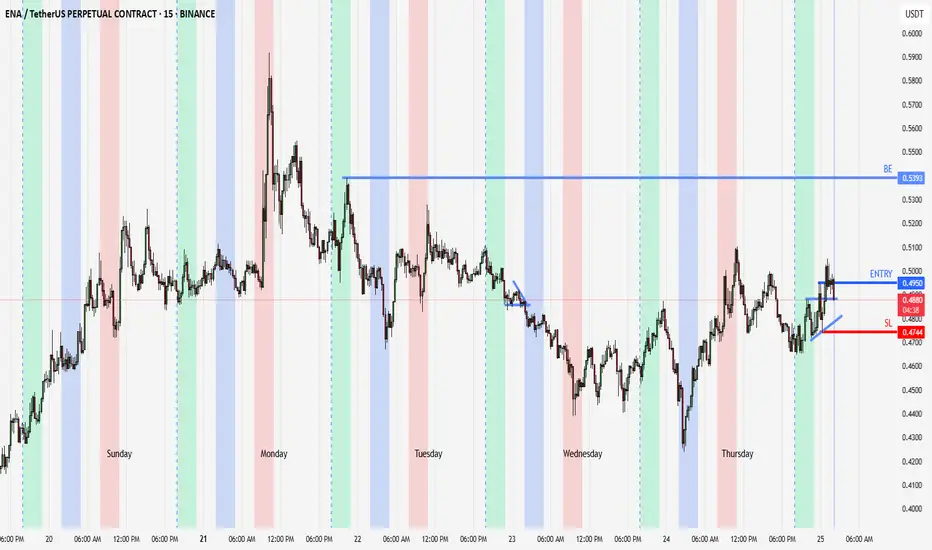
Ena scalp long to $0.3930 areaena scalp long
Stop: $0.3613 or lower
Tp: $0.3930
Potential early closure $0.3848

21:1 risk-to-reward trade setup for EthenaIs it time for the bulls to push it higher? This setup offers a 21:1 risk-to-reward ratio with a target of 1.25.
Entry 0.32
Stop loss 0.25
Target 1.25
ENA | Waiting for Trendline BreakENA is demonstrating strength by trading above its weekly SMA-10, indicating underlying bullish momentum.
Key Technical Levels:
Current resistance: Green descending trendline around $0.38
Critical pivot: $0.5140 level
Bullish Scenario:
A break above the descending trendline could trigger signi

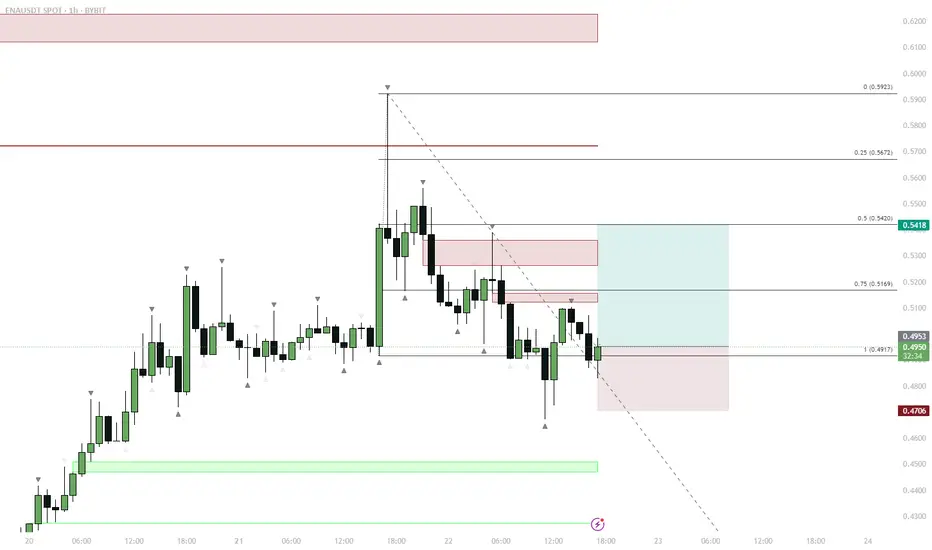
ENA — Range Deviation & Reclaim: LTF Long Setup
ENA traded in a tight LTF range, then deviated below support, forming a sweep/liquidity grab.
Price quickly reclaimed the range low and retested the FVG (Fair Value Gap) below the range.
This reclaim/flip is a classic bullish reversal setup after a sweep.
Entry on the retest of FVG and previo
ENA Coin Forms a W Pattern: Reversal Potential GrowsOn the global chart of the ENA coin, a W pattern is forming, indicating a possible reversal and growth. It is worth noting that since the launch, the coin has not yet realized its full potential.
Current price: $0.56
If the pattern is realized, a movement to the $0.58 zone is expected and in the c
outside day setup50% pullback to the 200ma on the daily chart. looking for it to go to new high. after an outside day it crossed above the 200ma and 20ma on the 15min.made a acending triangle supported by the 20ma, breakout in the gaptime and now pulls back and giving an entry at the open of london. looking to hold
See all ideas
Summarizing what the indicators are suggesting.
Oscillators
Neutral
SellBuy
Strong sellStrong buy
Strong sellSellNeutralBuyStrong buy
Oscillators
Neutral
SellBuy
Strong sellStrong buy
Strong sellSellNeutralBuyStrong buy
Summary
Neutral
SellBuy
Strong sellStrong buy
Strong sellSellNeutralBuyStrong buy
Summary
Neutral
SellBuy
Strong sellStrong buy
Strong sellSellNeutralBuyStrong buy
Summary
Neutral
SellBuy
Strong sellStrong buy
Strong sellSellNeutralBuyStrong buy
Moving Averages
Neutral
SellBuy
Strong sellStrong buy
Strong sellSellNeutralBuyStrong buy
Moving Averages
Neutral
SellBuy
Strong sellStrong buy
Strong sellSellNeutralBuyStrong buy
Displays a symbol's price movements over previous years to identify recurring trends.
Frequently Asked Questions
The current price of ENA / UST (ENA) is 0.57974000 USDT — it has fallen −3.14% in the past 24 hours. Try placing this info into the context by checking out what coins are also gaining and losing at the moment and seeing ENA price chart.
ENA / UST price has risen by 49.48% over the last week, its month performance shows a 127.14% increase, and as for the last year, ENA / UST has increased by 35.76%. See more dynamics on ENA price chart.
Keep track of coins' changes with our Crypto Coins Heatmap.
Keep track of coins' changes with our Crypto Coins Heatmap.
ENA / UST (ENA) reached its highest price on Dec 4, 2024 — it amounted to 885,580.00000000 USDT. Find more insights on the ENA price chart.
See the list of crypto gainers and choose what best fits your strategy.
See the list of crypto gainers and choose what best fits your strategy.
ENA / UST (ENA) reached the lowest price of 0.19651000 USDT on Sep 6, 2024. View more ENA / UST dynamics on the price chart.
See the list of crypto losers to find unexpected opportunities.
See the list of crypto losers to find unexpected opportunities.
The safest choice when buying ENA is to go to a well-known crypto exchange. Some of the popular names are Binance, Coinbase, Kraken. But you'll have to find a reliable broker and create an account first. You can trade ENA right from TradingView charts — just choose a broker and connect to your account.
Crypto markets are famous for their volatility, so one should study all the available stats before adding crypto assets to their portfolio. Very often it's technical analysis that comes in handy. We prepared technical ratings for ENA / UST (ENA): today its technical analysis shows the buy signal, and according to the 1 week rating ENA shows the strong buy signal. And you'd better dig deeper and study 1 month rating too — it's strong buy. Find inspiration in ENA / UST trading ideas and keep track of what's moving crypto markets with our crypto news feed.
ENA / UST (ENA) is just as reliable as any other crypto asset — this corner of the world market is highly volatile. Today, for instance, ENA / UST is estimated as 19.62% volatile. The only thing it means is that you must prepare and examine all available information before making a decision. And if you're not sure about ENA / UST, you can find more inspiration in our curated watchlists.
You can discuss ENA / UST (ENA) with other users in our public chats, Minds or in the comments to Ideas.