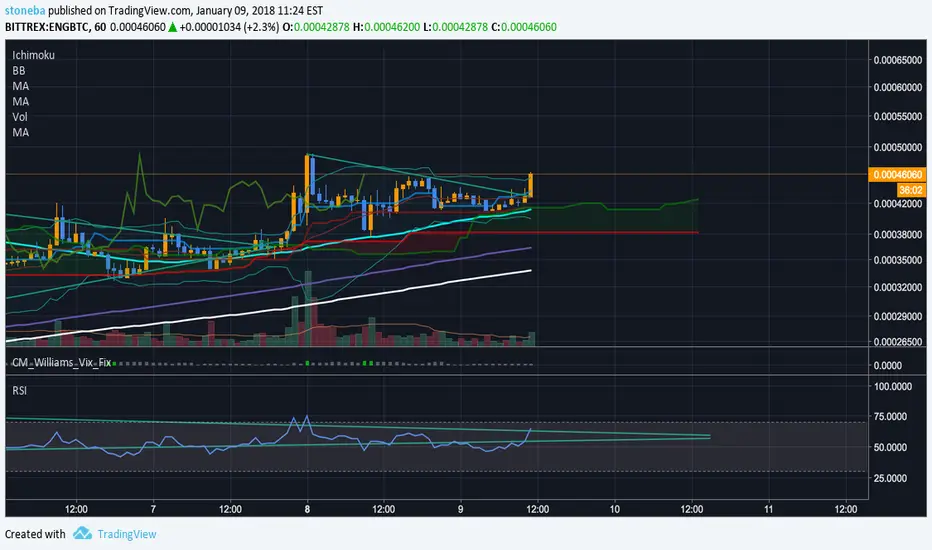
ENIGMA - On track to go WAY higherENG is pushing right along the major trendline without over exhausting itself. This is a very healthy bull run that has not yet had a moonshot. I'm staying in till I see those long wicks or it breaks this trendline. Looks like ENG is having a great day.
ENGBTC trade ideas

ENG - head and shoulder pattern possibilityif does , somewhere on 0.00026697 support we can bouce back up to next resistance 0.00049020 which give +/- 80% profit. (if/when H&S pattern formed)
if bounce on mentioned suppoer zone will not hapeen we will go way lower ( according to current sentiment on market bad scenario will not happen, all depends from BTC run so keep eye on it)

ENG ENIGMA-- ENIGMA --
TD Sequential 9 Green candlestick showing a potential reversal. Good luck, happy trading.

ENG 182% PROFIT IN SHORT TERMHi guys,
ENG is the one of my undervalued favorite coin and I think it'll reach higher and higher.
Target 1 : 70000
Then there will be a little correction.
Target 2 : 129000
(P.S. : I'm a beginner trader, trading for about 1 months. This is my opinion, do not invest your money based on what i drew. )
Have a great days..

ENG - Perfect buying opportunityLooking at the charts of enigma shows you a perfect buying opportunity. With the coin already being tenfold compared to 3 weeks ago, enigma does not show any sign of stopping. It is a contract based coin trying to solve privacy and scalability issues.
Buy in:
35000 - 46000
First Target:
83000
Bullish signals from MACD, Stoch and DMI!


Just wanted to show the support and resistance linesThese are the support and resistance lines of the 1 day chart and 4 hour chart.
Hopefully we sill see another rise up in Enigma.

Keep an eye on EnigmaIf it breaks above this flag, it could make a nice runner, if it falls below, watch for support around 40K sat. Im not a fan of the RSI and there isnt much volume but to be honest, all it takes is one guy with a lot of BTC to push this thing up. It also looks like a potential 5 wave to an elliot wave will form. I am also a fan of their project. Good luck fam!!

ENGBTC Enigma Coin BuyPattern is pretty straightforward, with an optimistic outlook. Buying more for tomorrow while dipped. Weak hands are folding Enigma.
Purchase 367 ENG on Bittrex at .00047991 BTC. Sell posted at 59797

ENG BTC OptimismCancelling previous sell for 25% gains.
This looks like BTC with a good bull run on the massively decreasing volumes, could be a huge upside 50% plus!
Get in below 50k sat


messy or sexy.either way its an enigma! bahaha. but also. gann fan, pitchfork, trendline for predictions, green is current fibs, yellow is extension fibs, red is extension resistance. Lets see which channel it follows, and which lines it uses. This is a super long play as the coin is solid and so is the team.


ENG set to break outEng has been following an elliot wave perfectly. Right now wave 4 is cresting right about wave 1, if it drops below it will fall out of elliot wave and all bets are off. It has a very strong support floor, though, so I don't think that's likely. Right now is the time to buy (highlighted in green), then ride the 5th wave up as us traders do. Enigma is traded on Bittrex and Binance, which is helping boost visibility too. Expect 10% in the next week at the very least.

ENG Broke out of an ascending triangle (30% increase expected)After a fake-out due to BTC dipping to lower support levels, ENG finally took off. The measured move from this traingle takes us to right between the 2.618 and 3 fibonacci lines.
We do have a potential to go beyond that to 70-80K, but that would mean we have to accelerate again.
During the last bull-run the chart showed price suppression by someone very big and very interested in Enigma - He's not wrong, because it is a great project. But could you please let it go :)
Enigma is part of my core position. I do have a small trading potition to trade on breakouts and corrections, but I'll never sell my core.

ENG (Enigma) heading towards end of bull runENG has been gaining a lot. Upward triangle and not being able to break resistance at 55k sat. Signals end of bull run

ENGBTC - Bear Pendant Complete - Possible new RestraintsENG has completed its signature bear pendant, and has now hit the bottom restraint identified in light blue.
Next test will be top restraint, which will test the strength of the bulls - if we return to the light blue line, this could indicate a reversal and an upward move over the next few hours.
However, a more consolidated uptrend below the previous lower restraint (dark blue) would indicate the trend would continue.
At this stage, I am neutral until the upper restraint is revealed - trending on 15 min graph primarily.

ENG BTC - Bears may take over below 3350Quick sketch to suggest that ENG may now fall below its restraint around 3350-3370 depending on descent of the current downtrend.
Descending triangle, and the lack of push in previous points of the triangle would suggest the bulls have been exhausted for now and the bears will take over as we move into the afternoon.
Opinion not advice.

$ENG.X if this setup peaks your interestsTook a position today at 52k sats... targets are as followed...
60k sats 80ksats 100ksats

ENG breaking out into new trading rangeENG appears to have a solid team and development community. The trade price doesn't seem to be directly following any social media hype which gives me some confidence that folks are just starting to assess the value of this coin. Following the charts, there's a pretty clear set of price moves that fit within a Fib profile from Dec 18 of last year to Jan 9 of this year. Each break out from the consolidation period in the ascending triangles maps well onto an extension from the previous price move and helps confirm the overall movement pattern.
Right now, I'm expecting the price to follow closer to the orange trend lines just because the volume hasn't picked up enough to push it up at the same rate of growth we saw after Christmas.
Price will likely spend some time trying to get through the sell wall at 58K satoshis,then peak above 60K for a little bit before correcting with some sell off before trying to rise up to 70K.
I'd recommend grabbing some profit at 60K satoshis, then buying back in when it hits the bottom support line. If the volume really starts picking up, then I would follow the same strategy, but follow the green trend lines with the higher targets.

ENG BTC breakout on smaller timeframe, Bullish breakoutLooks good on the 4H and Daily, too. I think they will catch up with the hourly. Volume incoming.