ENJBTC trade ideas

$ENJ, Lower highs and multiple tests of the ~650sats support$ENJ
Lower highs and multiple tests of the ~650sats support level (descending triangle)
I think we will see a break to the downside soon from here with support/target at ~520sats..
Always protect your capital for future opportunities
#ENJ
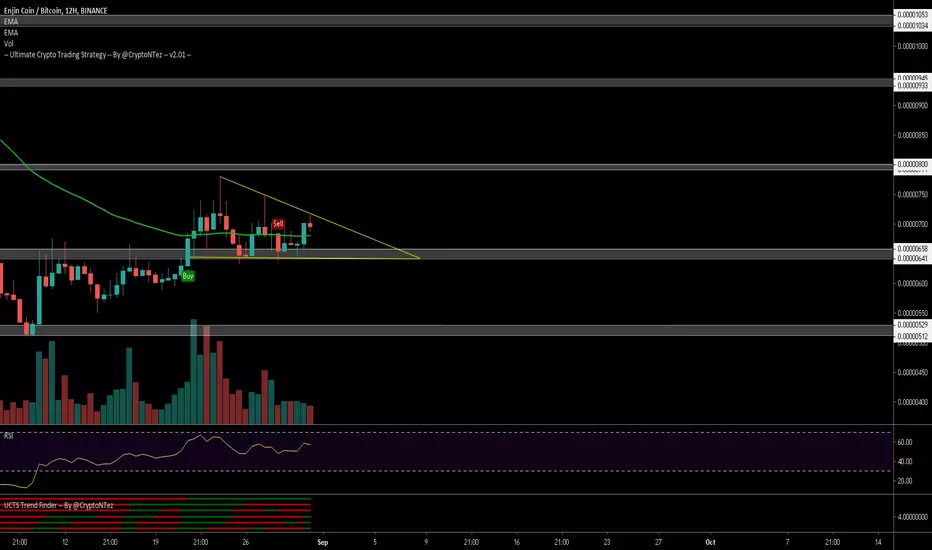
$ENJ, Massive volume flowed in (600+ BTC Binance volume)update on $ENJ
This is how the market says to you "F@ck your TA"
Massive volume flowed in (600+ BTC Binance volume) and a quick UCTS Buy signal was printed shortly after I tweeted
Currently showing some rejection at resistance level
Not interested unless r/s flip occurs
#ENJ

ENJBTC is something to look on...$ENJ is having a nice momentum to push higher right now. If BTC stays neutral for some time, the chances are very good. Watch on it.

ENJ/BTC IdeaHello, on the weekly time frame we see that we have hit the base support zone with this crypto pair.
Setting SL not too far lower than this support line. (Besides this; the daily rsi was forming a divergence indicating a change in trend) Happy trading :)


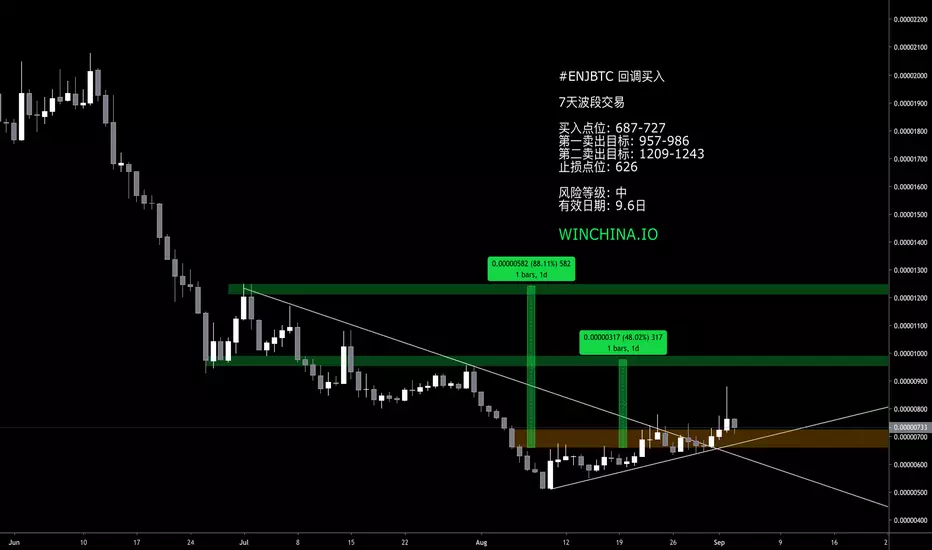
Enjin/Bitcoin (Aug 25) #ENJ $ENJ #BTC $BTCENJ is moving in a Bearish Flag, but it has just broke out from the bigger Bullish Flag so we can take risk here
Buy : Under 735
Sell : 945-955
Mid-Hold : 1165-1245-1320
Stop : Under 695

enj (enjin coin) enj have importnt point =0.00000749
case 1(green way ) : if enj hold 0.00000749 then will go to 0.00000938
case 2(red way ) : if enj cant hold 0.00000749 then continue according red way

$ENJ, Ascending triangle breakout following with a retest...$ENJ
Ascending triangle breakout following with a retest of now support at ~658sats looks tempting for a long opportunity here
Volume flowing in and rising (+350BTC in Binance)
UCTS Buy signal on the 12H(and almost every LTF)
Crossed over EMA50
As targets: ~800 / ~930sats
#ENJ


ENJBTC : ENJINCOIN CAN GIVE GOOD PROFIT 60% ?its on support zone , it can be ready for move in this week
keep eye on it..
details update will be coming soon

Enj long setupI bought a spot on #Binance, HTF support, broken bearish structure, high volume buying, etc
Targets and stop on the chart


ENJ newar breakoutEnjin has a profitable gap between now and 730 - almost with zero resistance in between. That may bring 15-21% profit. Near breakout now, but overbought at lower timeframes, so either jump on the leaving train with small amount, or wait for pullback.
Bullish entry 625-628
Pullback zone 610-620
Scalp 690
Main target 729
Bonus targets 798 - 830
Stop loss below 579
Stopless strategy - double order at ~515, sell at 570 or wait for targets

ENJ Bullish DivergenceEnjin looking good, this bull div is pretty long. That means the bigger the pop up. It's also sitting on some extremely long support with a MACD crossover and bullish stochastic RSI.


ENJ Thoughts$ENJ
Y'all better pray this last HVN that we're sitting on holds, if not that 300 sat level is looking like the next solid support level.

