ENJBTC, Possible price action!ENJ has a decent growth which could be marked as wave A/1, followed by correction as wave B/2 .
Lower TF for better entry both ways.
ENJBTC trade ideas

#ENJBTC following the long term exponential curve#ENJBTC Buy the dip opportunity: fractally repeating the previous structure and following the long term exponential curve, if it doesn't break under 1900 satoshis. Breaking under 1800 sat would mark a long term reversal, quite unlikely at this point I would say

#ENJBTC Bounce or die, (another) buy the dip opportunityLast (strong) support reached for $ENJBTC, touching the 3 months descending support/resistance line, the 6 months major upper trend support line (broken once during one week in March), and the 100 days Moving Average.
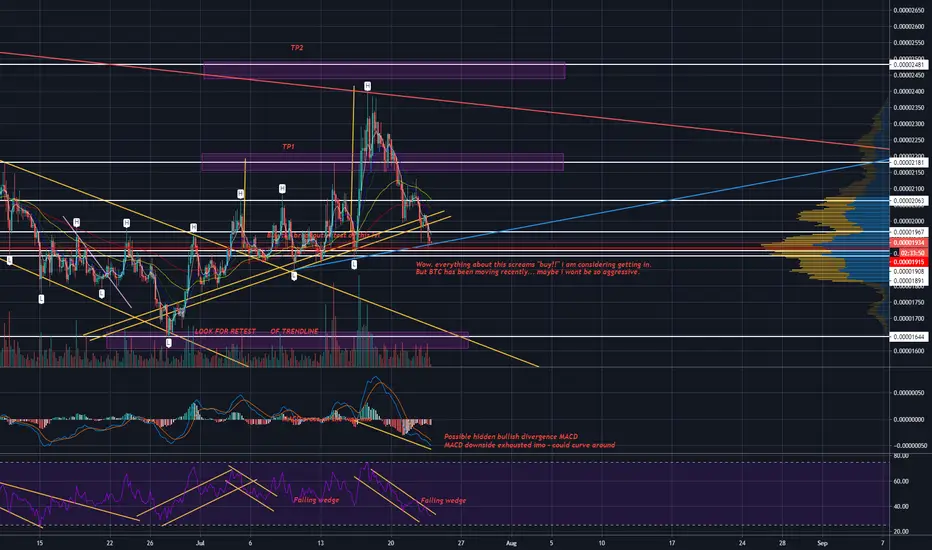
We are quite far down from the fractal pattern shared previously, and I moved the exponential rising line accordingly. I am still expecting the trend to resolve on the upper side. RSI is also touching an 11 months raising base line....
We shouldn't close below 1800 satoshis... After 3 days below that level on the daily, that would confirm a reversal, quite unlikely in my opinion.


ENJ BTCENJ BTC - bullish AF! lookin good. unless we break to downside from a large BTC move, but i bet it would fakeout and pop back into the bullish trend. lets go!


An interesting pair ENJINENJ/BTC and ENJ/ETH
Both forming H&S patterns
Could a hidden truth be possibly found within these pairs structure, regarding ethereums decoupling from bitcoin?
Comment below if you spot anything or if im just an ETH fanboy
A chart for the USD pair
I recently added more of this coin!

ENJBTC Ready to take to 3500Broke through diagonal resistance (red line, previously support) and is now retesting. If we hold above this line, a pump to 3500 is imminent. HODL mode.

ENJIN Head and Shoulders FormingHead and shoulders formation
It could go parabolic and break the formation
Here is where i first identified the H&S


ENJ ON FIRE! CHARTS SHOWS LOT OF BULLISH SIGNALS!ENJ/BTC - BULLISH NEWS - BIG MOVE COMING?
ENJ shows bullish signs after get listening at some DEFI Plattforms. In my Opiion DEFI is the next huge thing!
Be prepared for it!
Entry: Between 0.00002235 BTC - 0.00001985 BTC
TP1: 0.00003409 BTC
TP2: 0.00004120 BTC
ITS NOT A FINANCIAL ADVICE, I JUST SHARE SOME IDEARS AND TRY TO CREATE SOME CONSENSUS ABOUT KRYPTO!
IF U HAVE ANY QUESTIONS, PLEASE FEEL FREE FOR SENDING ME A PN
#BUYBITCOIN - CHEERS!

Enjin Coin Signal (200% Potential Profits)[ENJBTC]Here is our full trade signal for Enjin Coin vs Bitcoin (ENJBTC).
This is not financial advice.
Remember to have a plan/strategy before trading.
---------------
Enjin Coin | ENJBTC
BUY: 0.00001650 - 0.00001900
TARGET:
1) 0.0000002112
2) 0.0000002310
3) 0.0000002550
4) 0.0000002900
5) 0.0000003300
6) 0.0000003800
7) 0.0000004450
8) 0.0000005660
POTENTIAL PROFITS: 200%
STOP: Close weekly (W) below 0.00001300.
---------------
Remember to hit LIKE if you want to see more like this.
Namaste.

megaphone pattern with bullish rsi and good volume,enjbtc have good 2 weekly chart, I think it gonna blast in coming days.

ENJ/BTC (Another Leg up?)ENJ/BTC
-the cross ultimate indicator flashes signal last Dec 2019
-after then, the price continues its uptrend to date
-currently just broke the local resistance at 2191 sat
-now, it must maintain above previous resistance
-or at least pullback to retest and flip into new support
-staying above the green box is bullish
-trading priority is to Buy when a breakout is confirmed


Enjin Bounces of Ascending Channel Support - Buy OpportunityI really like this set up for Enjin vs BTC. The price action has been moving within this ascending channel since 2019 and recently confirmed support, giving us a nice bullish continuation setup. I outlined an inverse head and shoulders set up in green. It actually looks like we already broke the neckline and completed the pattern, but the price has returned back to the neckline which gives us a second chance to buy some before lift off. The MACD is bullish, holding above the zeroline with a near cross over the signal line. I'm long here! Look for resistance at the top of the channel, but don't be surprised if we bust right through it.


ENJBTCH&S and nice Breakout from this bull flag , close retested the daily support , its ready to take off !

