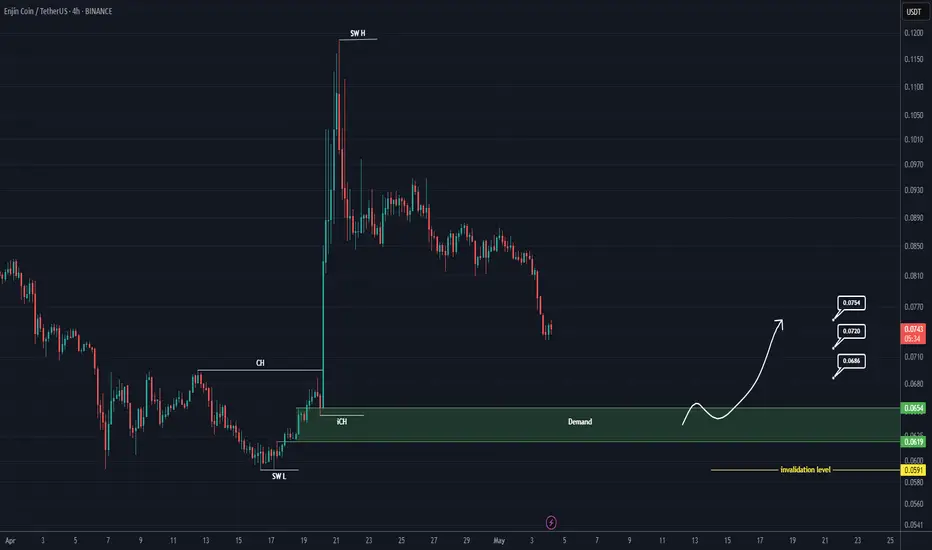
ENJ - 4H Uptrend, after expected correctionHere is a short analysis based on the chart's elements:
Trendline Breakout: The price has decisively broken out of a long-term descending white trendline, which previously acted as resistance. This is a strong bullish signal, suggesting the end of the downtrend.
Market Structure Shift: The chart s

ENJUSDT 1W AnalysisENJ ~ 1W Analysis
#ENJ Buy back gradually from this support block with a short-term target of at least 20%++.

0.0020!I believe ENJ will exit the market after a significant fall, so it's not a good time for long positions.

ENJUSDT 1D#ENJ has broken above the Ichimoku cloud and the daily MA100, showing strong bullish signs. It's now on the verge of a breakout above the descending resistance on the daily chart. 📈
If the breakout confirms, potential targets are:
🎯 $0.1384
🎯 $0.1874
🎯 $0.2270
🎯 $0.2666
⚠️ Don’t forget to use a t

ENJUSDT 1D AnalysisENJ ~ 1D Analysis
#ENJ Buy after successfully breaking through this resistance line with a short-term target of at least 10%+.

ENJ: The Return of the OGs#Enj confirmed a new low in April, rebounding from the 100% Fib extension of the Mar–Dec 2024 move.
The recent strong bounce adds to its bullish potential. Holding above $0.059 (key support) is essential to fuel a potential bullish run.
#Enjin

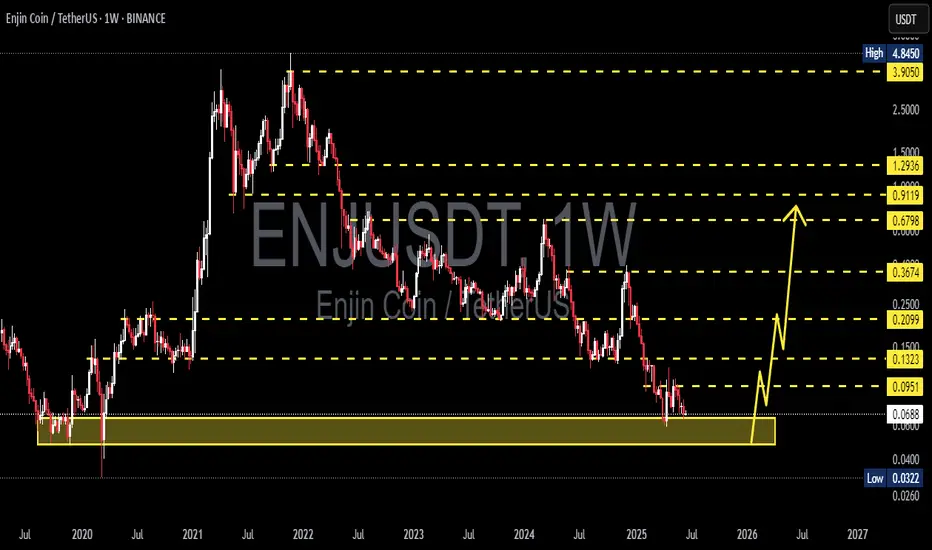
Enjin Coin Grew 14,946% (150X) Between March 2020 & Nov. 2021Here it is important to start with the linear chart to be able to appreciate the fact that Enjin Coin is trading at bottom prices. You know the log. scale distorts it a little bit but this one can really show that ENJUSDT has been trading at the bottom for a long, long time. And you know what I love

ENJ Buy/Long Setup (8H)After a bullish move and the formation of a strong change of character (CH), followed by a FOMO-driven ENJ rally, the price is now approaching support zones. In areas where strong buyers were previously active, we can look for a buy/long position.
The origin of this move is expected to hold, and pr
ATLAS/USDT 1W🌱 NYSE:ENJ ⁀➷
#Enjin. Macro chart Another
🌴 Intermediate Target - $0.76
🍃 Macro Target 1 - $1.15
🍃 Macro Target 2 - $2.01
🍃 Macro Target 3 - $3.28
- Not financial advice, trade with caution.
#Crypto #Enjin #ENJ #Investment
✅ Stay updated on market news and developments that may influence the

See all ideas
Summarizing what the indicators are suggesting.
Oscillators
Neutral
SellBuy
Strong sellStrong buy
Strong sellSellNeutralBuyStrong buy
Oscillators
Neutral
SellBuy
Strong sellStrong buy
Strong sellSellNeutralBuyStrong buy
Summary
Neutral
SellBuy
Strong sellStrong buy
Strong sellSellNeutralBuyStrong buy
Summary
Neutral
SellBuy
Strong sellStrong buy
Strong sellSellNeutralBuyStrong buy
Summary
Neutral
SellBuy
Strong sellStrong buy
Strong sellSellNeutralBuyStrong buy
Moving Averages
Neutral
SellBuy
Strong sellStrong buy
Strong sellSellNeutralBuyStrong buy
Moving Averages
Neutral
SellBuy
Strong sellStrong buy
Strong sellSellNeutralBuyStrong buy
Displays a symbol's price movements over previous years to identify recurring trends.