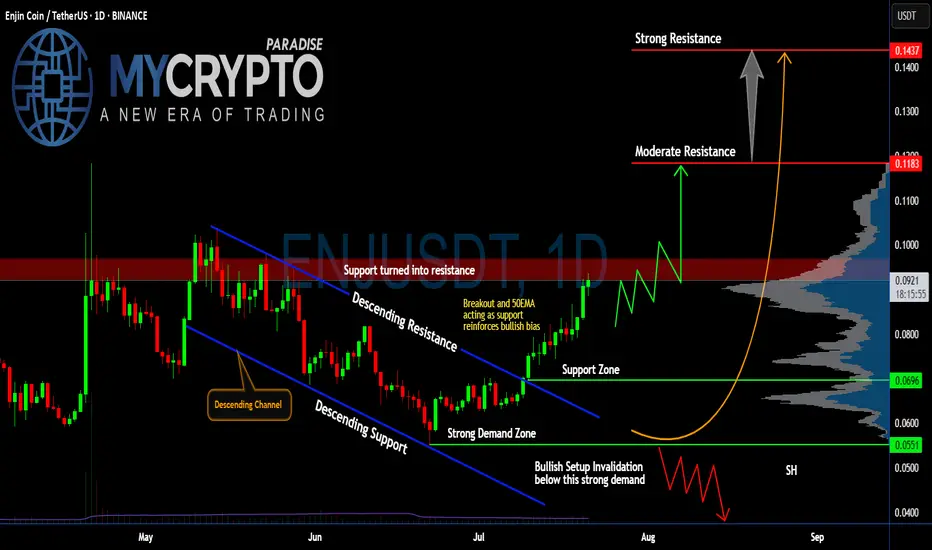
Will #ENJ Soar Further or a Trap is Set Ahead? Watch Closely Yello, Paradisers! Is this breakout on #ENJUSDT the start of a strong bullish reversal, or just another trap before a brutal flush to shake out late buyers? Let’s break it down:
💎After weeks of bleeding inside a clear descending channel, #EnjinCoin has finally broken out of the descending resistance, showing the first real bullish momentum in a while. Price is currently trading around $0.0917, with the 50EMA now acting as fresh support—this adds weight to the bullish bias for #ENJ.
💎If bulls can break above the resistance zone (previously support) between $0.091 and $0.096, we could see a push toward the moderate resistance at $0.1183. That’s the first major hurdle where sellers are expected to step in. A clean breakout above this level would open the door for a larger move toward the strong resistance at $0.1437, where a heavy supply zone sits, and profit-taking will likely accelerate.
💎The strong demand zone between $0.0551 and $0.0696 has been respected multiple times in the past, with aggressive buying every time price dipped into it. This is classic accumulation behavior, which often precedes stronger impulsive legs up—if volume keeps supporting this move.
💎But don’t get trapped, Paradisers. If the price breaks back below $0.0696 and especially loses the strong demand at $0.0551, the bullish setup for #ENJUSD will be invalidated. That would likely trigger a deeper correction, pushing us back toward $0.04. We’ll wait patiently for the next high-probability setup before taking any new positions.
Stay patient, Paradisers. Let the breakout confirm, and only then do we strike with conviction.
MyCryptoParadise
iFeel the success🌴
ENJUSDT trade ideas
Enjin Coin Ready for a Truly Major Advance · PP: 941%Technical analysis is truly an exact perfect science, when mastered. If you master this tool you can use it successfully to make very strong and accurate predictions.
If you can make one prediction right, then the tool works.
If you can make several correct predictions, then the tool being valid is confirmed.
If some predictions fail, we have to assume our interpretation is wrong rather than the tool. If the tool is the one at fault, then all predictions would be either wrong or random. And since we can make thousands of highly accurate predictions, it means the tool works.
Back in late 2024 ENJUSDT was rejected twice at EMA89 resistance. As soon as it broke above this level it produced a strong advance. This wasn't enough and the market moved lower. As it reached a major low point in April and June 2025, the same conditions showed up.
ENJUSDT was rejected twice below EMA89 as resistance, notice the red arrows on the chart. Currently, Enjin Coin managed to conquer EMA89 and this is bullish. Looking at past history and knowing what we know about EMAs, this means that the doors are open for a strong bullish wave.
Enjin is set to produce a major advance and this is already confirmed. Just like late 2024 but much stronger, prices will go much higher because we are in the year of the bull market, post Bitcoin halving, every four years. Marketwide growth is happening and will only increase. This pattern has never been broken, it is already happening, it is confirmed and guaranteed.
Namaste.

ENJ - 4H Uptrend, after expected correctionHere is a short analysis based on the chart's elements:
Trendline Breakout: The price has decisively broken out of a long-term descending white trendline, which previously acted as resistance. This is a strong bullish signal, suggesting the end of the downtrend.
Market Structure Shift: The chart shows multiple "ChoCH" (Change of Character) and "BOS" (Break of Structure) to the upside, indicating a shift from a bearish market structure (Lower Lows and Lower Highs) to a bullish one.
Predicted Path: The large yellow arrow drawn on the chart illustrates the forecast. It predicts a potential small dip or consolidation to retest the broken trendline as new support, followed by a significant upward move.
Target: The arrow points towards the upper red resistance/supply zones, suggesting a potential target price around the 0.07200 level.

ENJUSDT 1W AnalysisENJ ~ 1W Analysis
#ENJ Buy back gradually from this support block with a short-term target of at least 20%++.

0.0020!I believe ENJ will exit the market after a significant fall, so it's not a good time for long positions.

ENJUSDT 1D#ENJ has broken above the Ichimoku cloud and the daily MA100, showing strong bullish signs. It's now on the verge of a breakout above the descending resistance on the daily chart. 📈
If the breakout confirms, potential targets are:
🎯 $0.1384
🎯 $0.1874
🎯 $0.2270
🎯 $0.2666
⚠️ Don’t forget to use a tight stop-loss

ENJUSDT 1D AnalysisENJ ~ 1D Analysis
#ENJ Buy after successfully breaking through this resistance line with a short-term target of at least 10%+.

ENJ: The Return of the OGs#Enj confirmed a new low in April, rebounding from the 100% Fib extension of the Mar–Dec 2024 move.
The recent strong bounce adds to its bullish potential. Holding above $0.059 (key support) is essential to fuel a potential bullish run.
#Enjin

Enjin Coin Grew 14,946% (150X) Between March 2020 & Nov. 2021Here it is important to start with the linear chart to be able to appreciate the fact that Enjin Coin is trading at bottom prices. You know the log. scale distorts it a little bit but this one can really show that ENJUSDT has been trading at the bottom for a long, long time. And you know what I love to say; once we hit bottom, there is no other place left to go but up.
ENJUSDT Long-Term Weekly Linear Chart:
Knowing that the action is happening at bottom levels immediately reveals what will happen next. And knowing what this is, we can prepare.
Now let's focus on the log. chart to be able to spot the highs and lows and do the analysis. That's the main chart above.
There was already one break of strong support which is the November/December 2020 low.
The five years strong low last month (April 2025) activated levels from late 2019 and March 2020 but still a long-term higher low.
The action is happening now within a very strong long-term accumulation and buy zone; buying here, you can't go wrong.
This is the place where the whales and very smart money buy their Altcoins. This is the best possible time and entry price to load up on Enjin Coin if you were someone that is looking at these charts to make money from the upcoming bull market rise.
If you've been waiting, the wait is over.
Oh, and by the way, Enjin Coin grew an astonishing 14,946% between March 2020 and November 2021, that's more than 150X.
Who said the Cryptocurrency market isn't wild?
Prepare for massive growth.
Namaste.

ENJ Buy/Long Setup (8H)After a bullish move and the formation of a strong change of character (CH), followed by a FOMO-driven ENJ rally, the price is now approaching support zones. In areas where strong buyers were previously active, we can look for a buy/long position.
The origin of this move is expected to hold, and price is likely to move toward higher zones.
We are looking for a buy/long position around the demand zone.
Targets are marked on the chart.
A daily candle close below the invalidation level will invalidate this analysis.
For risk management, please don't forget stop loss and capital management
When we reach the first target, save some profit and then change the stop to entry
Comment if you have any questions
Thank You
ATLAS/USDT 1W🌱 NYSE:ENJ ⁀➷
#Enjin. Macro chart Another
🌴 Intermediate Target - $0.76
🍃 Macro Target 1 - $1.15
🍃 Macro Target 2 - $2.01
🍃 Macro Target 3 - $3.28
- Not financial advice, trade with caution.
#Crypto #Enjin #ENJ #Investment
✅ Stay updated on market news and developments that may influence the price of Enjin. Positive or negative news can significantly impact the cryptocurrency's value.
✅ Exercise patience and discipline when executing your trading plan. Avoid making impulsive decisions driven by emotions, and adhere to your strategy even during periods of market volatility.
✅ Remember that trading always involves risk, and there are no guarantees of profit. Conduct thorough research, analyze market conditions, and be prepared for various scenarios. Trade only with funds you can afford to lose and avoid excessive risk-taking.

ENJ/USDTFormer President Trump once famously declared, “We’re going to start winning again—winning so much that you may even get tired of winning.” That same confident tone now echoes in his messaging to the cryptocurrency community, as he signals support for a sector that continues to draw attention amid macroeconomic uncertainty.
Recent geopolitical tensions and rising tariffs have contributed to volatility in traditional equity markets. As investor sentiment cools in response to these headwinds, capital appears to be rotating into safe-haven assets like gold. However, with gold trading near premium entry levels, some investors may begin to eye riskier, high-upside alternatives—including digital assets—as a long-term play.
This scenario sets the stage for a potential altseason, where capital flows into alternative cryptocurrencies gain momentum. Among these, Enjin Coin (ENJ) stands out as a project showing technical promise.
After a period of consolidation, ENJ traders has pushed the price for a last low, likely serving to grab liquidity at lower levels. This move may have flushed out overleveraged long positions and weak hands, creating a foundation for a more sustainable rally. The recent price action shows signs of a possible bullish reversal, particularly if confirmed by strong follow-through in the form of high-volume daily candles.
While confirmation is still required, ENJ’s current setup could represent the early stages of a broader upward trend—especially if supported by continued market rotation into the crypto sector and a resurgence in retail and institutional interest.
Related News:
-Blockchain in a Blink: Bringing Enjin to 1 Billion Telegram Users with Substreak

ENJ Spike 63% Gearing For 300% Surge Amidst Bullish Flag PatternThe price of Enjin coin ( NYSE:ENJ ) broke out of a bullish flag pattern surging 63% for the past 24 hours. With growing momentum, the asset is gearing for a 300% breakout.
One key factor contributing to the surge is the launch of the Enjin NFT SDK, which enables seamless integration of non-fungible tokens (NFTs) into various platforms, paving way for NFT's on the ENJ ecosystem.
As of the time of writing, NYSE:ENJ is up 19% setting the course for a 300% breakout. The asset has formed a perfect bullish flag pattern with the ceiling of the pattern already broken, NYSE:ENJ will be aiming for the $0.32 resistant and beyond.
With growing momentum as hinted by the RSI at 71.89, NYSE:ENJ might just be the asset to look out for this week.
What is Enjin ( NYSE:ENJ )
Enjin is a blockchain platform that makes it easy for developers to integrate NFTs and digital assets into their games and apps.
The platform provides tools for creating wallets, minting tokens, and managing transactions without requiring users to understand complex blockchain technology.

ENJ | Expected 33% Gain!The Falling wedge is on the verge of breakout, in case of successful breakout expecting massive bullish rally on daily timeframe✅
Expected 33% bullish wave in coming days🎯🚀

ENJ - Cup & HandleMorning folks, happy Good Friday.
Saw this Cup & Handle and figured I'd share it with you guys. Could bring some nice quick profits!
Trade thirsty!
Happy Easter!

ENJUSDT | One of Today’s Top Volume Gainers – +197.5% in 24hENJUSDT has attracted serious attention today, with trading volume jumping nearly twofold over the last 24 hours. That kind of activity usually signals big players are involved, so it’s worth watching closely—even though the price itself isn’t showing strength right now.
🔴 Price Still Weak Against Key Levels
The red boxes on the chart mark important resistance zones where ENJ has repeatedly stalled.
Each test of these areas has been met by sellers, and until price can close convincingly above them, bulls remain on the back foot.
📊 How to Trade This Setup
Short Entries
Wait for ENJ to rally into a red box, then look for lower‑time‑frame downturns with CDV confirmation.
A clear breakdown inside those zones gives a high‑probability short signal.
Long Entries
If ENJ breaks above a red box with strong volume, watch for a retest of that level as support.
Only after a successful retest and confirming bounce on lower time frames will I consider longs.
🤝 Why This Matters
I focus on the coins that lead the market in volume, because that’s where the real opportunities lie. These resistance zones aren’t random—they reflect genuine supply and demand dynamics. If you’ve been following my updates, you know my win rate is among the highest around. That’s because I never chase trades; I wait for clear, confirmed setups.
I will not insist on my short idea. If these levels suddenly break upwards and do not give a downward break on the low time frame, I will not evaluate it. If they break upwards with volume and give a retest, I will look long.
Stay patient, trade with confirmation, and let the market show you the way.
📌I keep my charts clean and simple because I believe clarity leads to better decisions.
📌My approach is built on years of experience and a solid track record. I don’t claim to know it all but I’m confident in my ability to spot high-probability setups.
📌If you would like to learn how to use the heatmap, cumulative volume delta and volume footprint techniques that I use below to determine very accurate demand regions, you can send me a private message. I help anyone who wants it completely free of charge.
🔑I have a long list of my proven technique below:
🎯 ZENUSDT.P: Patience & Profitability | %230 Reaction from the Sniper Entry
🐶 DOGEUSDT.P: Next Move
🎨 RENDERUSDT.P: Opportunity of the Month
💎 ETHUSDT.P: Where to Retrace
🟢 BNBUSDT.P: Potential Surge
📊 BTC Dominance: Reaction Zone
🌊 WAVESUSDT.P: Demand Zone Potential
🟣 UNIUSDT.P: Long-Term Trade
🔵 XRPUSDT.P: Entry Zones
🔗 LINKUSDT.P: Follow The River
📈 BTCUSDT.P: Two Key Demand Zones
🟩 POLUSDT: Bullish Momentum
🌟 PENDLEUSDT.P: Where Opportunity Meets Precision
🔥 BTCUSDT.P: Liquidation of Highly Leveraged Longs
🌊 SOLUSDT.P: SOL's Dip - Your Opportunity
🐸 1000PEPEUSDT.P: Prime Bounce Zone Unlocked
🚀 ETHUSDT.P: Set to Explode - Don't Miss This Game Changer
🤖 IQUSDT: Smart Plan
⚡️ PONDUSDT: A Trade Not Taken Is Better Than a Losing One
💼 STMXUSDT: 2 Buying Areas
🐢 TURBOUSDT: Buy Zones and Buyer Presence
🌍 ICPUSDT.P: Massive Upside Potential | Check the Trade Update For Seeing Results
🟠 IDEXUSDT: Spot Buy Area | %26 Profit if You Trade with MSB
📌 USUALUSDT: Buyers Are Active + %70 Profit in Total
🌟 FORTHUSDT: Sniper Entry +%26 Reaction
🐳 QKCUSDT: Sniper Entry +%57 Reaction
📊 BTC.D: Retest of Key Area Highly Likely
📊 XNOUSDT %80 Reaction with a Simple Blue Box!
📊 BELUSDT Amazing %120 Reaction!
I stopped adding to the list because it's kinda tiring to add 5-10 charts in every move but you can check my profile and see that it goes on..

ENJ/USDT Perfect Sell Opportunity After Recent RallyThe Enjin Coin (ENJ) is showing strong overbought signals on the hourly timeframe, presenting an attractive selling opportunity with a favorable risk-to-reward ratio.
Technical Analysis:
Current price: 0.0671 USDT with recent rejection at 0.0674 resistance level
RSI (14) reading: 65.00, showing momentum shift after reaching overbought territory
Volume profile: Trading volume of 447.81K shows significant activity but potential exhaustion
Market structure: Price formed a clear resistance zone between 0.0671-0.0685
Key Observations:
ENJ has formed a potential double top pattern with clear resistance at the 0.0674 level
The price action shows signs of bullish exhaustion after the recent rally from 0.0630
RSI indicator has been trending downward from overbought levels, suggesting diminishing buying pressure
Price is currently testing a key resistance zone with visible rejection wicks on the hourly candles
Trade Setup:
Entry point: 0.0671 (current price) or on rejection from 0.0674 resistance
Stop loss: 0.0685 (above recent swing high)
Profit targets:
Target 1: 0.0650 (previous support level) - 31% of position
Target 2: 0.0630 (strong support zone) - 49% of position
Target 3: 0.0619 (green zone support) - 20% of position
Risk Management:
Maintain a risk exposure of maximum 2% of total capital
Suggested position size based on volatility: ~145 ENJ
Risk-to-reward ratio: 1:3.2 (excellent opportunity)
Current market sentiment reflects fear (Fear & Greed Index: 32), creating conditions where retail traders may panic sell on the first signs of downward movement, accelerating our targets.
Remember, proper risk management is crucial - stick to your exit strategy regardless of short-term price action

ENJUSDT 1WENJ ~ 1W Analysis
#ENJ Buy gradually from here if you still have a Conviction on this coin with a short -term target of at least 20%+.

THREAD 2: OVERVIEW COIN LIST (LONG TERM) Dear you,
I’m launching this thread and updating it with a lengthy list of coins that followers have sent me to support long-term mapping and strategies for each.
The list is pretty extensive—I’ll add it here. You can scroll through and check for your coins in this post.
I’m kicking things off with ENJ as the lead coin and using it as the cover image.
1. ENJUSDT
Here’s the deal: ENJ is in the process of bottoming out on the monthly and 6-month timeframes. That means if you bought ENJ earlier, your account’s likely taken a big hit by now.
DCA-ing? It probably hasn’t improved things much.
ENJ will turn profitable once the monthly timeframe sparks a new uptrend slope. For now, there’s no confirmation of a bottom on the monthly (M) chart to signal the next leg up.
But it’s too low to drop much further—the real question is how long it’ll take to shift upward again on M.
You can stack ENJ at this price right now:
Spot: Long-term
Hold Time: Follow the monthly (M) cycle

ENJ can make a jump to resistance levelIf you can see at the ENJ History, it has done equal action in past.
ENJUSDT 1WENJ ~ 1W Analysis
#ENJ If you still have a Conviction on this coin. Maybe this support you can consider to start buying back with a short -term target of at least 20%+.

ENJUSDTHi friends..
in ichimuko & order block strategy, you can check this one too!!
please analyze it yourself friends
best regards
