Enjin Coin ENJ bearish sentimentSeptember has major catalysts for the crypto market as well as for the stock market.
The Ethereum merge on September 6th, that will end on Sept 20, the inflation report on September 13 and the next FOMC meeting afterwards with the new interest rates hike.
That is reflected in the crypto space in general as a bearish outlook.
Enjin Coin ENJ has a negative overall sentiment recently.
I have the following price targets:
ENJ/USDT short
Entry Range: $0.49 - 0.56
Take Profit 1: $0.45
Take Profit 2: $0.38
Take Profit 3: $0.29
Stop Loss: $0.63
ENJUSDT trade ideas

#ENJUSDT 6H Chart
Price broke below the support line and it is currently bouncing off the 4h demand zone. MACD is not clear, RSI is sold and EMAs are bearish. I expect price to move up from here towards the 12h supply zone at $0.63 however we shall wait for confirmation.

Enjin CoinEnjin Coin Technical Analaysis Basically on elliott waves and Priceaction Strategy
Enjin coin can be 4$
Wait and watch.

ENJ Scalp - Very easy long😏ENj is awesome candidate for long since:
⭐️ BTC bullish
⭐️ Domination looks bearish
⭐️ We have 5 days of accumulation
⭐️ Spread is getting lower
⭐️ 4th approach
⭐️ Volume increases at top
⭐️ 50 ATR
⭐️ Over VWAP
Will enter when price slowly squeezes to the levelon 5m timeframe, the base will form and the tape will get faster.
Fix profit by parts:
1% - 1/3
2% - 1/3, stoploss to breakeven
What's left, hold to the maximum
What do you think of this idea? What is your opinion? Share it in the comments📄🖌
If you like the idea, please give it a like. This is the best "Thank you!" for the author 😊

#ENJUSDT 12H Chart
Price is currently bouncing off the support line as well as the 12h demand zone. MACD is showing bearish weakness, RSI is sold and EMAs are turning bearish. I expect price to reach the 12h supply at $0.64 before potentially moving down to liquidate to trendline.

#ENJUSDT 12H ChartPrice is currently bouncing off the 7h demand zone. MACD is bearish, RSI is sold and EMAs are neutral. I am still waiting for confirmation before going long as overall price should take out the liquidity resting above the equal highs at $0.75.

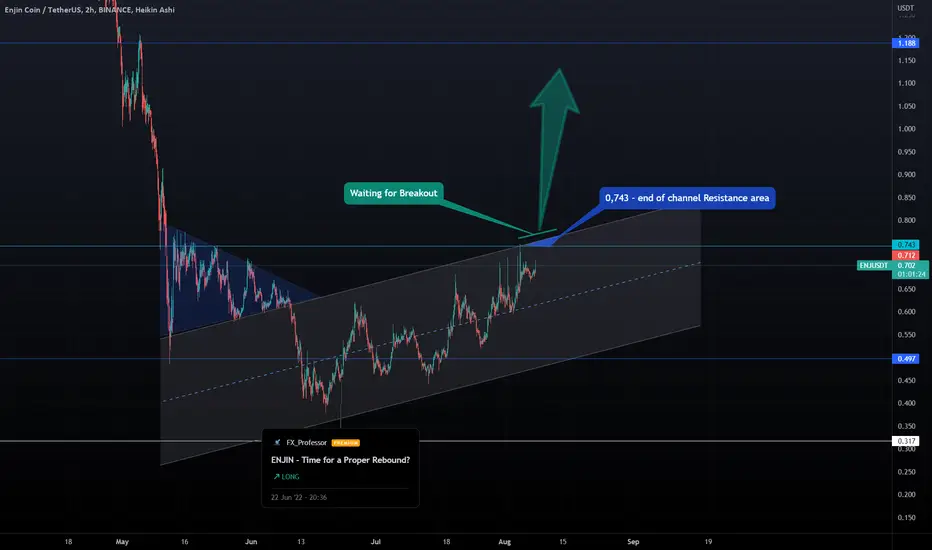
ENJIN - Updated ChartHi everyone,
Professor here and time for announcements:
I have decided to take it easier with charts for the next period and focus on education.
In my time here at Tradingview I have met a lot of (mostly) nice people striving to 'find out' what will happen next and how they can trade and make money.
💭 Allow me to say that the vast majority (90%+) fail to do anything good with the information they receive here:
- People don't realize that analysis (either Technical or any other kind ) and predicting 'what will happen next' is just not enough. Ever.
- I would say that Prognosis (right word for what you think is Analysis) is less than 20% of the success
- People don't know How to trade . (So why even look at charts? It won't help you much)
- Even traders with experience and knowledge..it's what they want them to know thus they struggle too
- The understanding of Trading that the average Trader gets from what's online is just WRONG
- Not knowing is fine. 'Knowing'' something that is fundamentally wrong is Bad news (exactly the case with some here)
- People do not know how to MANAGE their positions. That's number 1 issue
- They (and probably YOU) don't know how to manage yourselves, your emotions, your budgets or the market. That's the main issue.
👉 So why keep posting charts so often when the problem is something different?
There are TONS of material out there but I have seen nothing that meets my criteria and can actually help new traders in a simple, understandable, structured way that can work.
💡 So i decided to take some time off and create exactly that:
An easy to understand Method that works for beginners. Look for it in September.
I will be Back,
The FXPROFESSOR

ENJ could be in a downtrend - Cryptoz18 (Risk High)❶ Warning
Operations in the Blockchain or FX market represent a high risk. Cryptoz18 is a content creator who posts his ideas for viewers however he never provides an investment recommendation. I recommend to the reader a good risk management and knowledge regarding the environment. Thank you very much.
❷ Tutorials
➤ Here you can find a brief explanation of how the operations work in case you are interested in following them.
➤ Here you can find an explanation of how to track our ideas:
✔️ Our operations are taken with StopLoss and Take Profit of 15 minutes. However, we are looking to try and catch a 4H trend. So, once we touch the TPM according to your own analysis you should consider whether to close the trade or move StopLoss to entry.
❸ Summary
First I have to open my trades on Binance, if not then I don't have time. Sadly it took me a long time and a lot of the movement just happened, if it doesn't go back to that entry consider changing the setup settings.
❹ Operational Information
• Entry price: 0.6826
• StopLoss: 0.7024 (Loss 2.90%)
• TakeProfit Minimum: 0.6624 (Win 2.90%)
• Recommended margin: 5% of the Futures account
• Recommended leverage: 1x.
• Temporality: 15Min - 4H


ENJUSDT is testing the 0.618 Fibonacci levelWe made more than 37% since my previous analysis, where the price had a breakout from the dynamic resistance and satisfy our rules for a new bullish impulse until the weekly resistance on 0.72$ area.
Now the price is testing the 0.618 Fibonacci level on 0.66$ and the market is trying to get more bull positions in order to create a new breakout from the 0.72$ area.
How to approach it?
IF the price is going to have a breakout from the weekly resistance and retest it as new support, According to Plancton's strategy , we can set a nice order
–––––
Keep in mind.
🟣 Purple structure -> Monthly structure.
🔴 Red structure -> Weekly structure.
🔵 Blue structure -> Daily structure.
🟡 Yellow structure -> 4h structure.
–––––
Follow the Shrimp 🦐

ENj - ENJUSDT
#ENJ $ENJ
-GARTLEY PATTERN
- Daily Frame
#This is my technical opinion and not a recommendation to buy or sell

ENJUSDT-Scalping 🎧 #ENJ - Scalping Excellent short selling area - #ENJUSDT - quick trade - GARTLEY PATTERN - In PRZ

ENJIN- Needs To Gain some Momentum (and Buyers)0.710 seems like a wall for Enjin at this stage.
0.66-0.64 area is where I would dare to go Long on this one.
In general, ENJIN seems to be very quiet this period and despite the fact that i hold bags from 44cents it kinda feels like i could had used this buying power in better ways...
Then again in many occasions great things happen in due time so i rather wait.
Enjin is great, I feel it will do well soon. It has happened before:
One Love,
The FXPROFESSOR

#ENJUSDT 12H Chart
Price is still heavily bullish and ranging in an ascending trend. MACD is not clear, RSI is bought and EMAs are working as support. Price should keep moving up to take out the equal highs at $0.75.

ENJ/USDTENJ/USDT
It is involved in the resistance of 73 cents.
If it cannot break it, it can drop up to 48 cents.
#ENJ #ENJUSDT #BTC #BTCUSD #LUNA #LUNC #UST

ENJUSDTHello my dear friends
According to the negative divergence of RSA, if the price range of $0.573 is completely consumed, then the probability of reaction to the yellow area ($0.697) is high.
From the yellow area, we expect the formation of a corrective trend up to the range of $0.515 and $0.418.
We would be happy to hear your comments.

🕹️ ENJIN - Potential Breakout 🍊Market becoming Bullish early this week as you have been informed:
I think this time is ok to FOMO:
US printing money to fight inflation.. take a wild guess what that can do to Bitcoin (🚀🚀🚀🚀).
BTC Technical analysis:
Still in ascending channel . The Top (resistance) is just below 25k . I see 70% chances of breaking over the channel and off to 28k Resistance (our first target as given few weeks ago).
Watch the video and take a look at THIS:
After the Falls we naturally get a lake
I think it ended up being Perfect.
One Love,
The FXPROFESSOR
🕹️ ENJIN - Trading Can be Simple 🍊I love ENJIN, it's one of my favorite but remember:
The most common mistake is not taking profit (and/or not going short and hedge spot holdings at resistances):
My first target of 0,743 was checked: Allow me to say it worked perfectly.
What do i do in this cases?
Sell some spot and try a short position...The wait for support to take profits from short and buy more spot.
If you are reading this read it again (and again).
Nothing wrong with being greedy as far as one can be aware.
One Love,
The FXPROFESSOR
(Idea is posted as Long because Enjin could be 3$ again sooner or later)

Long ENJ/usdt After a move from the bottom of the ascending channel, Bitcoin has reached the middle line of the channel with good momentum and appropriate volume, and by completing a pullback to the middle line of the channel, you can enter a buy position and make a profit up to the top of the channel.
good luck friends

#ENJ, Set up some alerts in case it decides to go for it.#ENJ
A break above the range formed over the previous three months could be an great sign of further continuation.
Set up some alerts in case it decides to go for it.

ENJUSDTIf you leave the yellow box, it is possible to climb up to the specified lines, and the three final goals are also specified. Everything depends on the king. Bitcoin. Please write your opinion about my idea. Thank you

ENJUSD Up Trend and Similar FormationsSimple uptrend showing a recovery being posed by ENJIN Similar formations can be seen in white rectangles

ENJUSDTHello Crypto Lovers,
Mars Signals team wishes you high profits.
This is a one-day-time frame analysis for ENJUSDT
Here we have R2 that is a resistance line and shows that the price is unable to rise. R1 used to be a support area as well as S1 and S2 which all express the support of the price since the past. Also, the purple line is a 4-hour resistance line. At the present, we have the price fluctuating below the purple line and we predict a rise for the price to this line and then by being rejected, it will fall to S1. Note that S1 is a determinant area for the price to have a rise or fall. Thus by receiving some confirmation candles here, we will decide for the movement of the price. Remember that when the price reaches R1, it would be a good area for saving profits.
Warning: This is just a suggestion and we do not guarantee profits. We advise you to analyze the chart before opening any positions.
Wish you luck
