ENJIN - Failure to Break over 70 cents = UncertaintyENJIN is one of my favorite ALTS and i do have high expectations.
At the same time, failure to rise and test the key 74 cents Resistance brings worries.
Price is in an ascending channel, similar to Bitcoin's
The 49 (technical) - 50 cents (psychological) Support is strong but we do live in very uncertain times. Thus the 31 cents scenario is not to be crossed out completely; not yet.
Structure is still bullish and hopefully this is just a small correction of the rebound.
Breaking over the 74 cents would be a huge technical breakout for ENJIN and it could be possible this week but let's be prepared for everything.
One Love,
the FXPROFESSOR
ENJUSDT trade ideas

ENJUSDT time to bounce?The price is testing an important area as support, on 0.886 Fibonacci level and daily and 4h support.
The price has an order block on 0.5$ area
How to approach?
The price needs to create a breakout from 0.55$ area. So if the price is gong to have a breakout from that resistance, According to Plancton's strategy , we can set a nice order
–––––
Keep in mind.
🟣 Purple structure -> Monthly structure.
🔴 Red structure -> Weekly structure.
🔵 Blue structure -> Daily structure.
🟡 Yellow structure -> 4h structure.
–––––
Follow the Shrimp 🦐

ENJ/USDT Breakout was madeHey Traders,
ENJ moved just as we wanted and now we see a great opportunity for this coin. We are setting some buys here and if it from as well. Breakout was made!! Stop is must have if 4hr closes below $0.460
If you like ideas provided by our team you can show us your support by liking and commenting.
Yours Sincerely,
Swallow Team 🔱
Disclamer:
We are not financial advisors. The content that we share on this website are for educational purposes and are our own personal opinions.

this is a testthis is a testthis is a testthis is a testthis is a testthis is a testthis is a testthis is a testthis is a testthis is a testthis is a testthis is a testthis is a testthis is a testthis is a testthis is a testthis is a testthis is a testthis is a testthis is a testthis is a testthis is a testthis is a testthis is a testthis is a testthis is a testthis is a testthis is a testthis is a testthis is a testthis is a testthis is a test

#ENJUSDT 4H Chart
Price is still ranging in a downtrend after getting rejected from the 4h supply and it is currently close to tapping into the 4h demand at $0.5. MACD is showing bearish weakness, RSI is sold and EMAs are neutral. If price closes below this demand zone then we would expect price to dive all the way down towards the major 6h demand at $0.41 before potentially moving up again.

ENJ/USDT Important level for coinHey Traders,
First time we are looking at ENJ/USDT and we see that it has gone for a breakout but stopped $0.68. As it it right now it is sitting at $0.63 which is important level for this coin! breaking down from here would mean $0.515 and holding this support would mean bullish run. Which way are we going!! what do you think))
If you like ideas provided by our team you can show us your support by liking and commenting.
Yours Sincerely,
Swallow Team 🔱
Disclamer:
We are not financial advisors. The content that we share on this website are for educational purposes and are our own personal opinions.

ENJIN- Intraday Chart 💹🌐Hello everyone,
market is bullish and might as well remain that way until fundamentals kick in (I expect GDP on the 28th and not so much rate hike on the 27th to slow things down).
For the time being I want to protect my Long positions from the past 3 weeks, it's going great but hedging might be needed today.
here is the chart, use it as you know best.
One Love,
the FXPROFESSOR

ENJIN- Chart of the DayPotential Breakout and looking to repeat the success we have had recently with :
Matic: (look how many good entries we posted before the Pump)
Fantom: (picked today's winner at a perfect entry again)
AAVE:
It's the way my trading is designed, always hedged, always looking for breakouts and always monitoring the developments in the market.....
oh, and always taking some profit before it reverses while keeping some of the position open in case of further rise.
One Love,
the FXPROFESSOR

Has she cooled off enough to consider some cautious buy orders?.43 to .37 is the lower end of the current "buy box" or support and buy zone i was looking for. there is support at .20 to .25 ish and below that is hard to tell who is still there and how bad general market panic would be at that point anyway.
if you take a serious ENJ position make sure and scoop an equal or at least, a worthy position in in MANA as well.


ENJUSDT Breaking it's resistance trend lineENJUSDT Technical analysis update
ENJUSDT is currently trading at $0.554
Buy zone: $0.540 - $0.556
Stop loss : $0.49
Resistance 1 : $0.605
Resistance 2 : $0.66
Resistance 3 : $0.75
Always keep stop loss
Thanks
Hexa

🕹️ ENJIN - Updated LevelsUpdated Professor chart on ENJIN.
0.564 is Resistance. Will the price be able to breach higher and off to 0.743 or will it need to dip a bit lower and check support?
Well...it depends on Bitcoin. Let's not FOMO and take it easy now.
I am taking some profit and waiting a bit.
One Love,
the FXPROFESSOR

ENJ could have a little setback - Cryptoz18❶ Warning
Operations in the Blockchain or FX market represent a high risk. Cryptoz18 is a content creator who posts his ideas for viewers however he never provides an investment recommendation. I recommend to the reader a good risk management and knowledge regarding the environment. Thank you very much.
❷ Tutorials
➤ Here you can find a brief explanation of how the operations work in case you are interested in following them.
➤ Here you can find an explanation of how to track our ideas:
✔️ Our operations are taken with StopLoss and Take Profit of 15 minutes. However, we are looking to try and catch a 4H trend. So, once we touch the TPM according to your own analysis you should consider whether to close the trade or move StopLoss to entry.
❸ Operational Information
• Entry price: 0.4997
• StopLoss: 0.5146 (Loss 2.98%)
• TakeProfit Minimum: 0.4861 (Win 2.92%)
• Recommended margin: 5% of the Futures account
• Recommended leverage: 1x.
• Temporality: 15Min - 4H

Crypto - Trade SetupMost ALTs haven't tested the main resistance level yet and even though they rejected beneath the resistance still there is a smell of bulls in the price action. Yes not so much interest yet but i'm expecting something more likely upward towards the resistance zone soon. But like i say market emotions change with the time so we must not stay rigid, we need to move along with the market.
Here are the key areas for my trade setup on ENJI against USDT, I'm saying again once the price reaches my zones I'll observe the market emotion clearly then only i get into the trade otherwise I'll look for another trade setup. This is what disciplined traders do so what are you doing ??
My calling : 0.5922
Note : I'll update once the trade setup got triggered!
Disclaimer : I'm not a financial advisor, trade at your own risk.


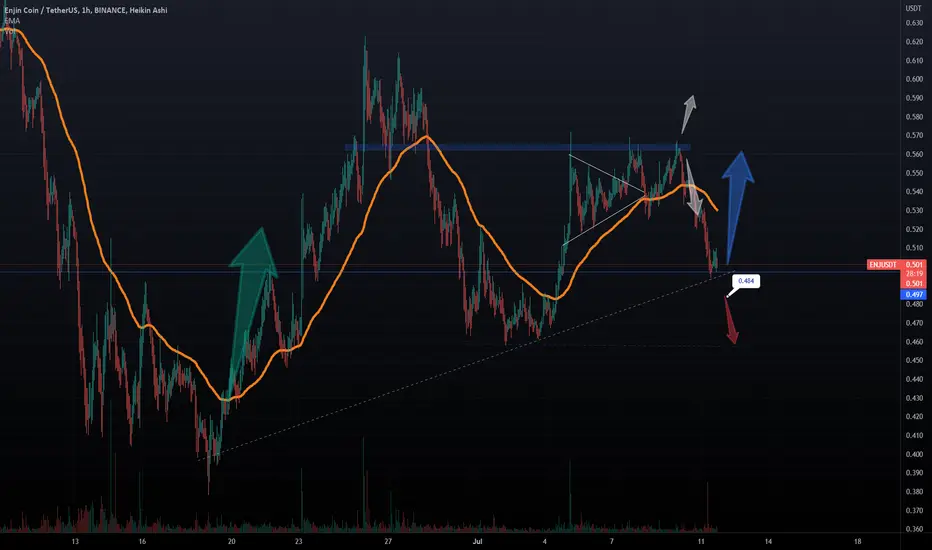
ENJIN - Intraday ChartUnclear again as support at 0,498 stands but 0,484 would trigger a further drop to 0,45 or lower.
Market as such is volatile and will continue to be that way so one needs to be careful and patient.
One Love,
the FXPROFESSOR
🕹️ ENJIN - Crypto Looking for a Reasonable Rebound 🍊I am Bullish, yes.
For reasons i have explained:
Not expecting a massive 'Bull run' (that is for later) but I am expecting a good, reasonable rebound.
Enjin chart is a good visual representation of my expectations.
One Love,
the FXPROFESSOR

#ENJUSDT 6H Chart
Price filled successfully the fair value gap at $0.56 and tapped perfectly into the 2h supply zone from where it got heavily rejected. MACD is showing bullish weakness, RSI is bought and EMAs are neutral. I expect price to keep moving down from here and i am currently monitoring it in order to try and catch a good entry.

ENJ - Powerbank is empty⚡ Reasons to take short:
⭐️ BTC bearish
⭐️ Trendline 9 days long
⭐️ Trendline is clean
⭐️ Buyer failed to update high
⭐️ Buying volume is decreasing
⭐️ Price is squeezing to the trendline
⭐️ 5th touch
⭐️ 60 ATR, coin at high
Will enter when price squeezes to the trendline on 5m timeframe, the base will form and the tape will get faster.
If you don't understand the previous sentence, just use swing stop-loss 3-5%
Fix profit by parts:
1% - 1/3
2% - 1/3, stoploss to breakeven
What's left, hold to the maximum
What do you think of this idea? What is your opinion? Share it in the comments📄🖌
If you like the idea, please give it a like. This is the best "Thank you!" for the author 😊
P.S. Always do your own analysis before a trade. Put a stop loss. Fix profit in parts. Withdraw profits in fiat and reward yourself and your loved ones

Enjin Coin (ENJ) - June 28hello?
Traders, welcome.
If you "follow", you can always get new information quickly.
Please also click "Like".
Have a good day.
-------------------------------------
(ENJUSDT 1W chart)
Below 0.563 is likely to be a mid- to long-term investment area.
The new Heikin Ashi low and the MACD's 'Buy/Sell' indicator fell at the same time and touched.
Therefore, if support is confirmed by rising above 0.635, it is expected to lead to further upside.
However, if it fails to rise and falls below 0.563, it can lead to a big decline, so careful trading is required.
(1D chart)
The key is whether it can find support at 0.563 and move above 0.673.
It may temporarily drop to around 0.484, so you need to trade cautiously.
------------------------------------------------------------ -----------------------------------------------------
** All indicators are lagging indicators.
Therefore, it is important to be aware that the indicator will move accordingly as price and volume move.
However, for convenience, we are talking in reverse for the interpretation of the indicator.
** The MRHAB-T indicator used in the chart is an indicator of our channel that has not been released yet.
** The OBV indicator was re-created by applying a formula to the DepthHouse Trading indicator, an indicator disclosed by oh92. (Thanks for this.)
** Support or resistance is based on the closing price of the 1D chart.
** All descriptions are for reference only and do not guarantee a profit or loss in investment.
(Short-term Stop Loss can be said to be a point where profit and loss can be preserved or additional entry can be made through split trading. It is a short-term investment perspective.)
---------------------------------

ENJUSDTPERPDue to the price reaching the resistance area and the inability to form a high ceiling, the price is more likely to fall.

ENJ - Engine goes brrr.. 🏎Reasons to take long if BTC will squeeze back to daily VWAP:
⭐️ Range for 11 days
⭐️ Level is clean
⭐️ 3rd touch
⭐️ Price is squeezing to the level
⭐️ Buyer appeared
⭐️ 35 ATR
⭐️ Over VWAP
Will enter when price squeezes to the level on 5m timeframe, the base will form and the tape will get faster.
If you don't understand the previous sentence, just use swing stop-loss 3-5%
Fix profit by parts:
1% - 1/3
2% - 1/3, stoploss to breakeven
What's left, hold to the maximum
What do you think of this idea? What is your opinion? Share it in the comments📄🖌
If you like the idea, please give it a like. This is the best "Thank you!" for the author 😊
P.S. Always do your own analysis before a trade. Put a stop loss. Fix profit in parts. Withdraw profits in fiat and reward yourself and your loved ones

🕹️ ENJIN - Breakout Can Continue 🍊ENJIN is a project we like a lot.
The market has taken a huge beating but some Teams seem to be working endlessly and this can reult in profits in the future. ENJIN is one of them.
NEWS:
Enjin to Launch a Beta Tester Program for Enjin Wallet 2.0 :
Developers from Enjin, a company that provides an ecosystem of interconnected, blockchain-based gaming products, have been developing a new version of the Enijn wallet, known as Enjin Wallet 2.0. Now, it appears that the wallet is approaching its launch, but before the team can release it, it first needs to put it through a beta tester program.
According to their recent announcement, the team is looking for experts who would join the tester program to check out the wallet, report on potential flaws, and generally help make the product better by providing feedback based on its current performance.
What is new in Enjin Wallet 2.0?
According to the team, the new wallet will offer a number of exciting new features. Not only that but it will be supported by top blockchains and NFTs. Some of the new features that testers and later users can expect include multi-chain support, dark mode, as well as a brand new dApp browser.
The team also stressed that these are only the features that will be available initially, right after the full launch. In time, they also plan to introduce a number of new things, although they did not specify which ones or when.
As for the supported blockchains that the wallet will support, those will include Bitcoin, Ethereum, Enjin, Litecoin, Dogecoin, Binance, Polkadot, Kusama, Acala, and Karura.
Apart from the mentioned features, Enjin Wallet 2.0 is also expected to come with some advanced improvements and features, such as the fingerprint scanner for greater security; custom fees and limits, import and sweep feature, auto-add tokens feature, support for over 25 languages, as well as the local currency where users can view the balance in their native currency, for an easier funds management.
Also: How Will Xchange Monster (MXCH) Impact The Gamefi Industry Along with Enjin (ENJ)?
Xchange Monster ( MXCH) is a fully-regulated platform by FINMA, one of the most recognised regulators in Switzerland.
One Love,
the FXPROFESSOR
