ENJIN- Ready for Higher?Enjin is doing Really well today and just broke over the double resistance.
Can ENJIN make it to TOP-15?
We think it will, the chances are increasing with the launch of smart contracts in the next 2 months(that's why it is trending), the launch of NFT. io and the fact that it is established as the LEADER in GAMING CRYPTO SPACE:
Destination next is 3,3. Probably break over that level and we can start looking for 5$ mark
One Love,
the FXPROFESSOR
ENJUSDT trade ideas


Do you think the price will increase or decrease?I have marked the support range with a green line and the resistance range with a red line.
There is a possibility of price growth from the green line.

Here is How ENJ can reach It's ATH once againHi every one
ENJIN COIN / TETHERUS
ENJ is in a Cup & Handle Pattern. The Break out Needed for Ascending Further Has Not Happened yet, But If The Expected Break out Happens, we Can See a Bullish Movement as Much as The Measured Price Movement. (AB=CD) if our Predictions become True, ENJ will reach It's ATH once again.
💎Traders, if you liked this idea or have your opinion on it, write in the comments, We will be glad.
Things can change...
The markets are always changing and even with all these signals, the market changes tend to be strong and fast!!
Thank you for seeing idea .
Have a nice day and Good luck


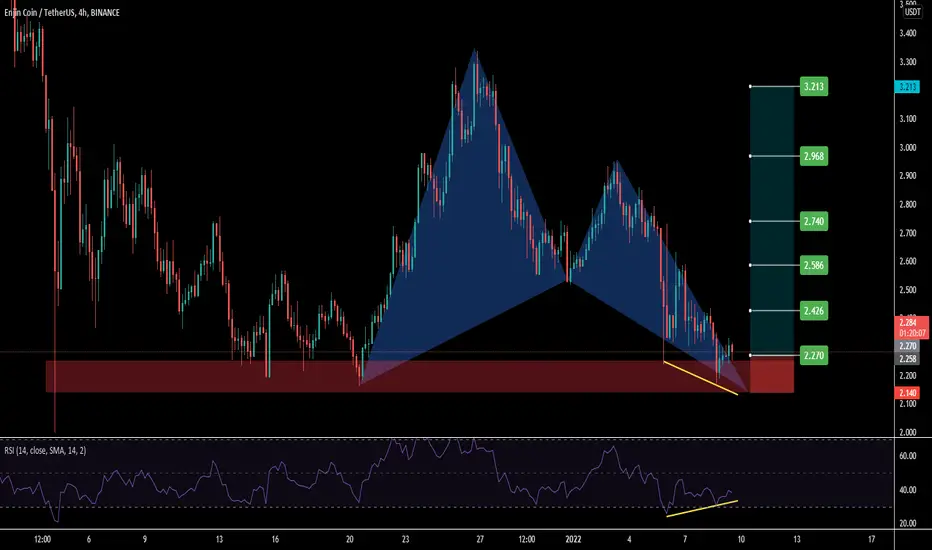
#ENJ Static support of Fib range 0.618.#ENJ Static support of Fib range 0.618.
#ENJ Harmonic Patterns.
#ENJ Divergence in RSI.
ENJ Long or short playwait for retest in this area. It broke the structure now we are seeing a retest to go short. Or we can see a recovery to go long


ENJUSDT Analysis (LOCAL VISION)Hello friends.
Please support my work by clicking the LIKE button(If you liked).Thank you!
Everything on the chart.
Entry: market and lower
TP: 3.2 - 3.6 - 3.9
after first target reached move ur stop to breakeven
Stop: ~2.1 (depending of ur risk). ALWAYS follow ur RM .
Risk/Reward 1 to 2.5
risk is justified
Good luck everyone!
Follow me on TRADINGView, if you don't want to miss my next analysis or signals.
It's not financial advice.
Dont Forget, always make your own research before to trade my ideas!
Open to any questions and suggestions.


ENJ - Open position in this scenarioBYBIT:ENJUSDT
4H trend chart
-
ENJ is converging and approaching to the end of triangle.
It encountered resistance from the downtrend line many times.
If price can breakout this trend line, trading strategy as below.
-
Profit Targets:
a) 2.9475----Fib(1)
b) 3.0645~3.1120--------Fib(1.272~1.382)
c) 3.2140----Fib(1.618)
Stop losses:
a) 2.6615-----Red horizontal ray
-
If you like this analysis, smash the "like button" and leave a comment below to share your thoughts
or let me know what crypto you want to see!
Trading is a reflection of yourself. Learn more daily and be ready for every opportunity.
Have a nice trading!

Sol ready to buy On the 3 day chart sol has hit the lows and is now safe to buy ready for next phase upwards.

Breakout might come soonOnly take this trade if we break out to the upside from this pattern.
breaking down can lead to more downside moments

ENJ!!!Still very new to TA and trying to learn a lot!
Any feedback is greatly appreciated!
Yellow box is the buy zone after the break and retest!

Is this a good Cup and Handle Pattern on ENJIN?I always wanted to buy ENJIN so maybe this is a good opportunity, not sure if it gets more discount.

enjusdtagr price triangle se down ki tarf nikalti hai tu nichy support tak ja skti hai or agr up side jati hai tu upr riss tak humara tp hoga

ENJENJ bounced from the support of $2.48-$2.56 area. The local resistance for ENJ is $2.95-$3.0 area and major resistance is $3.30 levels. We will see a rally towards all-time resistance if ENJ able to break and hold above the $3.30 resistance level. Keep an eye on the support and resistance levels.

ENJ ANALYSISHere's a quick look at ENJ 4hr chart . As we can see, the price has been showing a trend line resistance and moving also in the symmetrical triangle .
we need to break this triangle
Also formation of box t hat also need to break first for further go.
Now its time to wait and hold it
Definitely one to keep an eye on .
The best entry at Support level, also on trend support and after breakout and retest.
Targets
3.264$ , 3.956$ ,4.837$
THANKYOU

$ENJ - cup & handle with nice values ENJ's formed a cup & handle figure which is now trying to break the resistance line and if it does then I will be waiting for a retest of the breakout to enter long.

ENJ / USDTBuy at 2.75 & 2.87
T1 = 2.94
T2 = 2.99
T3 = 3.12
T4 = 3.70
Make your own analysis and risk management
at target 1 stop lose on entry point

ENJIN/USDT Falling WedgeENJIN looking pretty good, Low volume but very bullish setup here. Daily pattern so very strong in this case.

ENJUSDT is testing the 0.618 Fibonacci levelENJUSDT is testing the 0.618 Fibonacci level after the price bounced on our Weekly structure.
IF the price is going to have a breakout, from the weekly resistance (red one) According to Plancton's strategy (check our Academy ), we can set a nice order
–––––
Follow the Shrimp 🦐
Keep in mind.
🟣 Purple structure -> Monthly structure.
🔴 Red structure -> Weekly structure.
🔵 Blue structure -> Daily structure.
🟡 Yellow structure -> 4h structure.
⚫️ Black structure -> <4h structure.

The commence of ENJ pumping in upcoming hoursSince it seems that the downward trend has lost its power and the first HH peak is seen in the chart. An uptrend is expected in the hours ahead
Have a nice profit
