ENJ goes upthis should be 100% a short up, keep your bag tight, if this goes down, i eat shit on twitter
ENJUSDT trade ideas

ENJ - Future Projection SeriesDuring the downturns in the market I spent time learning more about utilizing the charting functions in TradingView. I also watch a lot of youtube vids about crypto and charting concepts. I came across a good chunk of info on using the “log” function and what it could possible show me.
At this point in the crypto cycle, even though I feel we are nearing a parabolic stage, it is beyond the point to expect 50X or more from me or any basic Joe who “dabbles” in crypto investing. Think long term. What can I realistically (if that even exists in Crypto) expect a coin to perform in the next bull run. Well the log function gives me a level playing field to do just that.
Using the log function, I utilize a common start date as the beginning of my parallel channel. That date is the big drop Mar/20. The parallel channel runs from the bottom of the Mar/20 drop forward in time along the bottom dips. The top of the channel is the highpoint in the cycle.
Additional note for ENJ: In the cycle, the preceding "mid-high"and following "mid Low" tells me that the following high will be proportionately higher and so I adjusted the parallel channel so the mid channel aligns with the preceding and following arcs.
The first future projection is created using the green trend lines, the first from the top of the cycle peak to the bottom, and another from that lowest point up forward in time to what I estimate as the timeframe for top cycle which approximates end of Q4, and my birthday Jan/7 so thats the future date for all graphs in this series.
The second future projection takes ratio’d growth into consideration. This is done using the blue trend line which starts at the first peak after the Mar/20 drop, using the top of arcs as the guidance. I carry this line forward to Jan/7.
Conclusion; At the time I drew this one the price was $2.55
First Projection $24.80
24.80 / 2.55 = 9.7 X
Second Projection $46.28
46.28 / 2.55 = 18.1 X
Now for a regular old fellow such as myself, a 9 to 18 X on my money within the next few months is a good investment. It literally involves 2 trades. Timing is not a great big deal as long as you get in near 2.55 otherwise the X factors changes a lot. Timing to get out is the top of the curve. This is a day time factor. It’ll be “at the top” for days or a week. You’re not chasing a pump or a knife here, its a month(s) trade. Or a parabolic week so watch close.
I’ve done this for a lot of coins now and the results are sometimes very interesting in that, a popular coin just doesn’t have the numbers or that it really has good numbers. I found as an average I like results in the 5 or above range for the first projection and 15 or above for the second projection. If I utilize this investment concept and choose coins with similar numbers I can reasonably expect a 10-15 X overall. I’ll post a few others I find interesting for this bull run in the coming posts.
My thoughts, not advice Oklah. Cheers

ENJUSDT is creating an ascending channel 🦐ENJUSDT is creating an ascending channel. IF the price is going to have a breakout, According to Plancton's strategy (check our Academy ), we can set a nice order
–––––
Follow the Shrimp 🦐
Keep in mind.
🟣 Purple structure -> Monthly structure.
🔴 Red structure -> Weekly structure.
🔵 Blue structure -> Daily structure.
🟡 Yellow structure -> 4h structure.
⚫️ Black structure -> <4h structure.

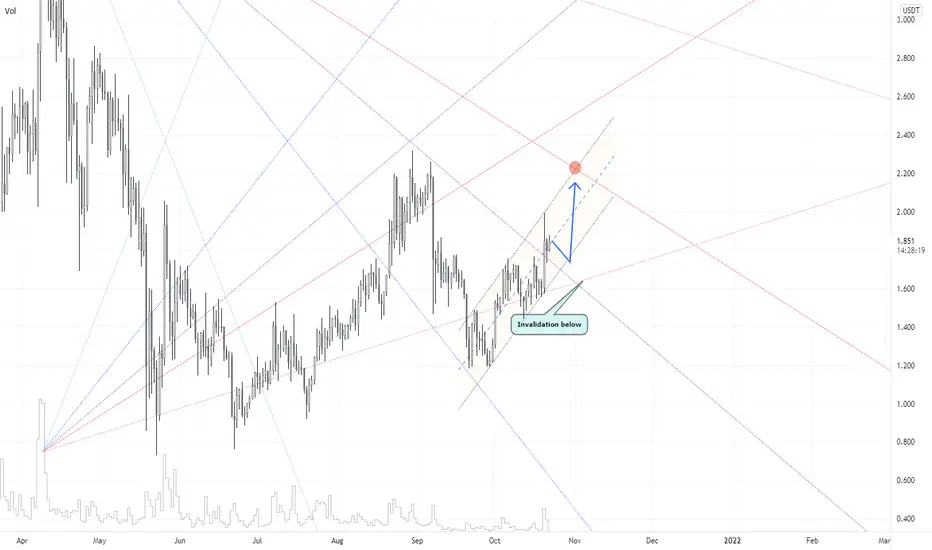
ENJ soon ready to test $2.20ENJ is cooling off on momentum getting ready for the next leg.
Target and invalidation on chart. Close to support area in the channel are the prices to get in.
enjusdti want to share this idea with yall, not recomendind to buy or sell i am not opening a position i am just want to show my idea. see when the RSI closes below 70 on the daily. back from oversold territory it usually continues the downtrend 80% of the time i have noticed, this is something i just discovered a few month ago. on every coin when the rsi closes back below the 70 mark it usually keep going down, its not 100% accuracy but uts somethiing i wanted to share :D


ENJ Trade 10-21-2021Reasons for entry
1. 3 EMA alignment
2. Consolidation retest
3. Series of HHs and HLs
4. Role reversals (Based on DNA)

Like always IDK MAN, but ENJ gon pomp Sheesh boi if you listened to my mana call you'd be rich and callin' yo ex by now.
Donations would be lovely and for once they would go straight to my spot account whatever you think i should hold Ill make an address and send it to me <3
much love for the follows and likes guys!

$ENJ1D:
* Bullish EMA Alignment
* Price is above 200 EMA
* BUllish MACD Cross
* Cup & Handle Formation
4HR:
* ADX > 25
* MA7 > MA25 > MA99
* MA50 > MA100 > MA200
* Supertrend is long
* Price > MA7
* Price > MA50
* Price > Tenkan Sen
* Price > Kijun Sen > Kumo
* Chikou Span > Price
* MACD > 0 and Bullish MACD Cross
* Volume is rising
* Upper Bollinger Band Breakout
* Bullish EMA Alignment


🚀ENJ/USDT trying to Break major resistance 💯ENJ/USDT forming bulish on 1D looking ready for a breakout major resistance area soon. ENJ is now reached the resistance Zone of the chart now then we see a good rally in ENJ. The next major resistance after breakout is 4$ previous ath level . If ENJ unable to break the previous ATH then we will see a retest of 3$-3.2$ support area. If breakout confrimed we can see bulish gain.
Not a financial idea. Wait for a breakout or rejection from here.
* DYOR

Enjine to Moon (Becoming Polkadot Parachain)BINANCE:ENJUSDT
As you know Enjine will be integrated into Polkadot Ecosystem by becoming one of its Parachain’s, which should boost the demand and price of the ENJ token big time.
parachains.info
In Terms of Elliott Wave, we finished 4 mayor Primary Impulse Wave moves, and are missing Wave 5 up to the upside to new all time highs. Which should last several weeks or months.
We clear $2.334 USD, a mayor resistance level, next one is about $4 USD. And if we clear that one, we should reach around $6 USD pretty soon. Right now, it is about $2.68 USD.
Mid-term, looks great, both fundamental and technically. Should be an easy doble before year end. With potential to go much higher.
Good Luck to You

ENJ short term buy zoneENJ is a metaverse coin and it can pump like blok and other metaverse's altcoins

ENJ/USDT Binance OutlookIt seems minor correction on enjin coin. bcos fibb targeting on $4 we can see on first week on Next Month.
its oppurtunity for buy more enjin coin. if u first bought dont fotget with 1% asset and stoploss

ENJ/USDT (Interval 1D) Cup & HandleCup & Handle formation identified, Highly likely this will breakout from horizontal line resistance.

Enjin EJNEJN coin is about to do its last leg for the Main 3rd wave. The target is anywhere from $25 - $29 on Last week of Nov or the week of Dec 6th. Lets wait and see for this to play out.

₿ ENJUSDT 1D ₿ : 29.Oct.2021 (Update)52% Profit after 2 weeks ... Also, the price has been successful in breaking the static resistance and is still advancing ...
Follow our other analysis & Feel free to ask any questions you have, we are here to help.
⚠️ This Analysis will be updated ...
👤 Arman Shaban : @Ar_M_An_4
📅 29.Oct.2021
⚠️(DYOR)

ENJ - Metaverse trending - Send it!Hello guys!
Following the metaverse trending, you should take a look on ENJ right now. As you can see, it has broken the previous resistance so try to buy some at the retest area. TP follow the chart! Thanks!
NFA!


ENJusdt buy nowENJ coin
buy now
follow me for more ideas
watch my previous ideas chart and see accuracy.

ENJ 1D : WEEKLY W PATTERN INCREADIBLEHello Everyone, If You Like The Idea You Can Support With A Like And Comment .
Keep In Mind ❗
🔴 Purple structure -> Weekly Structure
🟢 Green structure -> Daily Structure.
⚫️ Grey structure -> 4h Structure.
🟡 Yellow structure -> <4h Structure.
Important : Please Use RM (Risk Management) and MM (Money Management) If You Decide To Use My Ideas, There Will Always Be Unprofitable Ideas, This Will Definitely Happen, The Goal Of The System Is That There Will Be More Profitable Ideas At A Distance.

ENJ CHART ANALYSIS UPDATEENJ going according to plan.
Already up 28%.
As we can see in the chart we have a strong resistance level around 2.2$, once we cross it, the next resistance level will be around 2.7$.
Nothing has changed, my trade is still the same, hodl and enjoy the ride.
