ENJ is Ready To Leg Doen and we Open Sell Trade On it. Welcome to our crypto exploration hub! We're here to navigate the exciting world of digital assets, providing you with comprehensive insights into market dynamics and potential trading opportunities.Our mission is to decode the crypto market's mysteries and equip you with the knowledge you need to make informed investment choices. From the latest developments in Bitcoin to the hidden potential of various altcoins, we're your trusted source for daily technical analysis.While technical analysis is a valuable tool, it's important to remember that it's just one piece of the puzzle. We encourage you to take a well-rounded approach to your investments, considering factors like macroeconomic trends, news, and community sentiment.Join us for the freshest analyses, and don't hesitate to join the conversation in the comments below. Keep in mind that our content is purely for educational purposes and should not be construed as financial advice. Always integrate it into your broader investment strategy."
ENJUSDT trade ideas

ENJUSDTBINANCE:ENJUSDT Long idea
⛔"Daily crypto market analyses I provide are personal opinions & not financial advice. Trading carries risks, so do your own research & seek advisor's help.#DYOR"
Don't forget to like and comment

ENJUSDT Long/Short ... Just an IDEA ...ENJUSDT is @ BUY ZONE which is between R1 and SL given @ chart....
BTC's Next move will decide the uptrend for this coin....
Slowly u can enter @ this zone and keep Acc...(ABOVE .2310 Start Adding)
This can bring nice profit in cmg dayz...
NAFA n plzzz DYOR...
ThankYou....

ENJ Next Support & ResistanceENJ Next Support & Resistance
0.149601063
0.200009677
0.224170571
0.270237766
0.322452573
0.448084839

ENJ/USDT potential shift? 👀 🚀 ENJ Today Analysis💎Paradisers, gear up for a potential golden opportunity with ENJUSDT! Our observations show that it's navigating within a symmetric triangle, firmly holding onto a pivotal support level, hinting at an upcoming bullish phase.
💎Over the past month, ENJUSDT has been maneuvering within this tight triangular formation, with a crucial support at 0.2160. Our current outlook suggests a possible retest of this support zone before embarking on an upward journey. A breach of this structure would further solidify the bullish narrative.
💎 However, should the support falter, expect a pronounced downward shift. In such a scenario, strategize for a short entry post-retest.
💎 Remember to employ prudent trading strategies and use proper stop-loss measures! Stay alert to market movements and look forward to more insights


ENJ short period analysis NYSE:ENJ
Short period analysis ⏰
Simple s/R 💘 ☺️ 🎮🎯
Weekend candle was opened 😂 Strong below 📍 turn 💯 bearish 🛑
1st box 📍 is not big deal 🤝 but we see some pressure in lower time frame #LTF
$0.32-0.33 WILL be the 1st target 📌
In High time frame #HTF big yellow 🟡 box play key 🗝️ role 🙂
I don't think 💬 it will break so don't keep hopes on this coin too much bullish 😂
$0.44-0.544 will be my 2nd final Target 🎯
Let's watch 👀 how PYR liquid 💰 will support here 👍

EMA 10 crossing down EMA 50 Yes, when the Exponential Moving Average (EMA) with a shorter period (such as EMA 10) crosses down below the EMA with a longer period (such as EMA 50) on a 4-hour chart, this is often referred to as a "death cross." It is a bearish technical signal that suggests a potential shift in the trend to the downside, indicating the possibility of a bearish or downward movement in the price of the asset being analyzed. Traders often pay attention to such crosses as they can be used as part of their trading strategies to make informed decisions. However, it's important to consider other factors and conduct thorough analysis before making trading decisions based solely on this signal.

ENJ • CRYPTO LONG TF M30 , TP = 0.235#ENJ • CRYPTO
LONG TF M30 , TP = 0.235 , SL = 0.216
The trend continues, the nearest support level according to my calculations TP 0.235

ENJUSD ❕ tests the supportTD Sequential formed an up reversal signal (4H and 30m TFs)
The chart has reached the support level.
I expect a rebound.

ENJ sell TradeHere is My Study On ENJ
Welcome to my channel! Here you'll find daily technical analysis ofthe latest trends in the crypto market. From Bitcoin to altcoins, I'lIl be sharing my insights and predictions to help you make informed decisions
about your investments. Follow me for the latest updates and join the conversation in the comments!
Crypto technical analysis uses past price history to predict future price. It's not a guarantee and shouldn't be relied on solely for investment decisions. Consider other factors such as market trends, economic strength and
information dissemination. Use with caution.
This Is Not A Finacial Advise

ENJUSDTENJUSDT is in bearish trend.
Potentially printing LH and LL .
NO sign of trend reversal here.
we wait and watch for the breakout of last LL.

ENJ Longterm down trendENJ is currently testing its yearly low. If price can not stabilize above $0.22.
Looking to enter in a long term short position.
Market cap is around $250 Million.
Jan 2021 market cap was $110 Million.

ENJUSDTENJUSDT was trading under declining trendline and recently it seems like bulls are starting to take the charge and has given the breakout from declining trendline with significant bullish candles .
Currently the price is retesting the broken trendline , if the retest level holds it could be a nice buying option.
What you guys think of this idea?

📊#ENJ breaks out of triangle structure, goes to the moon?🧠ENJ has been running in this model for 1 year, and finally started to rebound after breaking the low point in 2022. Now we are near the first resistance level, and RSI has also appeared in an oversold state. I think we should not be too anxious, and should retreat to re-accumulate strength when we encounter the first resistance level, because we have consumed too much strength when we broke the triangle resistance line.
📉So I opened some short setups around the resistance looking for a short-term pullback
let us see👀

#ENJUSDT ANALYSISNYSE:ENJ is moving in a descending triangle. It bounced with a high volume from the horizontal support and attempted to break out the descending triangle, where it faced the MA 100.
A solid breakout of the triangle would be the bullish confirmation, while a rejection would result in further consolidation inside the triangle.


ENJUSDT 1DFalling wedge formation on daily chart. #ENJ is trying to break out the pattern + MA50 + MA100. Wait for confirmation and then my targets are on the table. Check them on the chart.

ENJUSDTENJUSDT was trading in range bound structure and and bulls took the charge and sharply and strongly break the range and break the local declining trendline as well.
If this breakout holds the next easy target for bulls can be 0.300

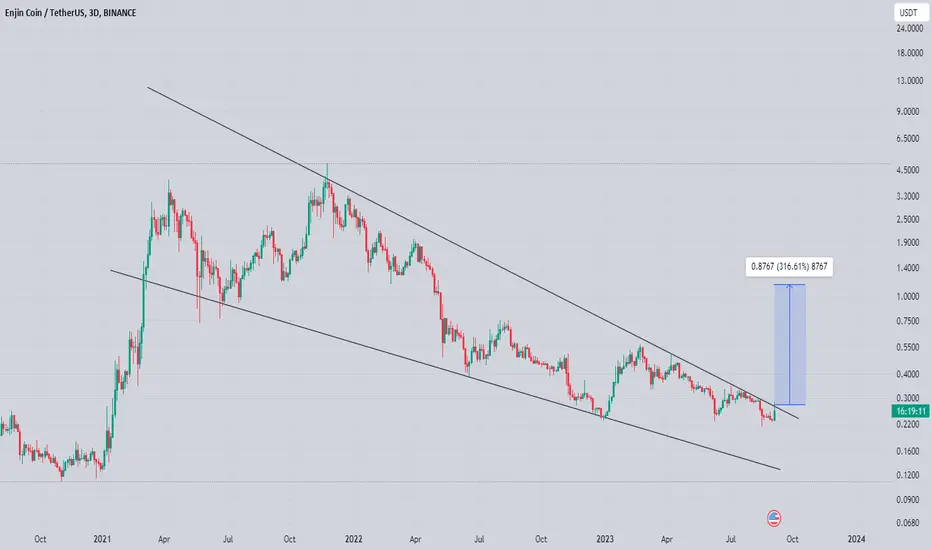
Enjin Coin Breaking Out Seems Like getting Ready For Massive Bullish Rally
Formed Falling And Building up for Massive Breakout In Higher Timeframes Still Not Out Of The Woods But Incase Of Successful Breakout Can Fly Towards 1$
Incase Of Successful Breakout Expecting 300% Bullish Wave In Midterm
$ENJNYSE:ENJ
On weekly timeframe level the price action broke down the Support Trendline level and retesting out there
If the price action closes below the MSS level we can further see the downwards towards till its next Sell Side Liquidity level

ENJUSDT ready for the breakout?ENJUSDT finds itself once more at a crucial juncture as it tests the significant weekly level at $0.23. This level holds substantial importance, as it has historically acted as a pivotal point that the market carefully scrutinizes. Traders are closely observing the price action, as it holds the potential to shape the pair's trajectory in the coming weeks.
The current scenario hinges on the possibility of the price harnessing new liquidity from this critical level, potentially setting the stage for a decisive breakout beyond the $0.26 mark. According to the trading principles championed by Plancton, a prominent figure in the trading community, such a breakout would signal an opportune moment to initiate a new long position.
Plancton's approach emphasizes the importance of liquidity and price confirmation. If the price manages to secure fresh liquidity from the $0.23 level and subsequently orchestrates a clear and convincing breach above the $0.26 range, it aligns with the rulebook set out by Plancton. This rule suggests that the conditions for a favorable long position have been met, potentially leading to a profitable venture for traders who adhere to this methodology.
–––––
Follow the Shrimp 🦐
Keep in mind.
🟣 Purple structure -> Monthly structure.
🔴 Red structure -> Weekly structure.
🔵 Blue structure -> Daily structure.
🟡 Yellow structure -> 4h structure.
⚫️ Black structure -> <= 1h structure.
Follow the Shrimp 🦐

ENJ BULLS TO TAKE OVER!Hello Traders and everyone, I am Hadi Karaali, Known as SNIPERS_FX
If you like the idea, do not forget to support with a like and follow.
What's next on ENJ.
Price is still around a strong support zone, where we are interested in new buy setups.
Meanwhile, we need some confirmation for the bulls to take over again!
And for the bulls to take over from a medium-term perspective we need a break above the first neckline which is a major swing high, then a movement higher would be expected to the next upper neckline.
Then we need a break above the upper neckline for a full bullish reversal.
Until that price is still around a strong support zone, where we will be looking for new bullish movement from a short-term perspective.
If you like this kind of analysis don't forget to like and follow
and as usual follow your trading plan and manage your risk.
Be patient and good luck!
