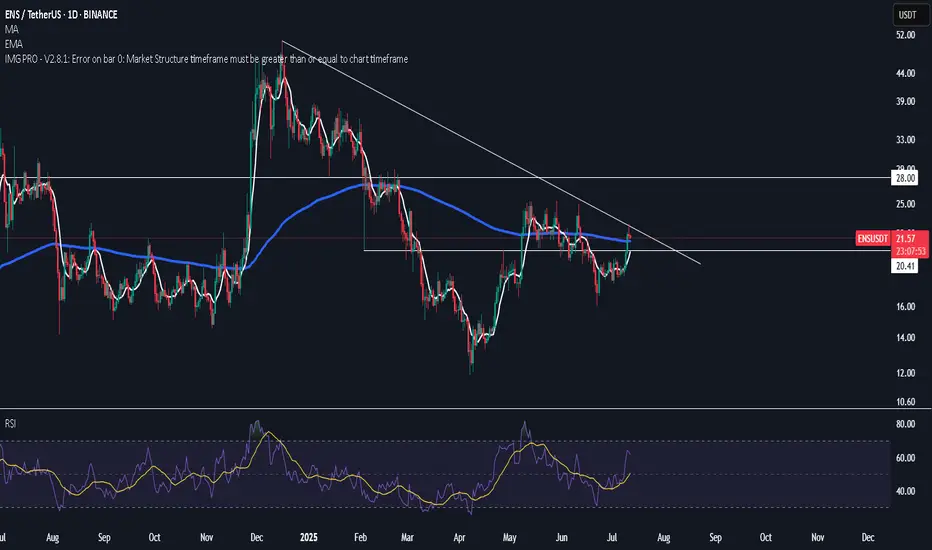
ENS 8H TF - Expect Further Downtrend
▶️ The downtrend is currently held by green support just above 24.00, but there are no signs that the decline is over.
▶️ The move from blue resistance to green support showed strong momentum, suggesting it may be blue wave A of a downside ABC pattern.
▶️ This structure implies that a corrective blue wave B may follow, eventually leading to a blue wave C to the downside.
▶️ The yellow ascending trendline, originating at the April low, is being monitored as a potential target for blue wave C.
▶️ However, it’s too early to confirm this path... further price action is needed to validate the ABC scenario.
ENSUSDT trade ideas

ens sell midterm"🌟 Welcome to Golden Candle! 🌟
We're a team of 📈 passionate traders 📉 who love sharing our 🔍 technical analysis insights 🔎 with the TradingView community. 🌎
Our goal is to provide 💡 valuable perspectives 💡 on market trends and patterns, but 🚫 please note that our analyses are not intended as buy or sell recommendations. 🚫
Instead, they reflect our own 💭 personal attitudes and thoughts. 💭
Follow along and 📚 learn 📚 from our analyses! 📊💡"

Ethereum Name Service (ENS): Looking For Smaller Dump, Then PumpENS coin has recently broken the branch of EMAs where sellers took full dominance near that zone and now we wait for a proper break of structure to form.
Once we get that BOS, we will be looking for smaller downward movement, after which we will be looking for upward movement. There are 2 ways that we can make money here so let's wait for confirmations now.
Swallow Academy

Ethereum Name Service Easy $131 Target · $208 Possible or HigherEthereum Name Service really took off in late 2023. March 2024 did nothing to this project. Here we can see an extended period of higher highs until December 2024. Many projects produced a major high in March 2024 to turn bearish until recently. In December, all of these produced a lower high. You can see how different this chart looks. This is a strong project the chart is saying.
There was a strong correction between December and April, this was a marketwide event. You can see how ENSUSDT moved below 0.786 Fib. retracement for several months just to recover. In June it remained below this level only briefly, for two weeks, and we are now full green.
Last week's candle closed above 0.618 Fib. retracement and we are back in the bullish zone. Full blown bullish as Ethereum Name Service is trading at the highest price since January 2025. Everything shows the market being ready for additional growth.
The recovery above support never supports a crash but instead a bullish continuation. For a crash, we would see a rejection or very weak action around resistance. Instead, we have full green candles with rising volume. Perfect conditions for higher prices. Just what we need and want to see.
The targets here are good, $131 and $208. I don't think this will be the end though and we have another wait and see. I think between $285 and $361 is a better prediction, these targets are also shown on the chart.
How far up do you think ENS will go?
Namaste.

ENSUSDT UPDATE
Pattern: Falling Wedge Breakout
Current Price: \$26.00
Target Price: \$48.00
Target % Gain: 140.90%
Technical Analysis: ENS has broken out of a long-term falling wedge on the 1D chart, showing strong bullish momentum. A clear breakout above resistance with a significant volume spike confirms the setup.
Time Frame: 1D

$ENSreclaim of 200 ema
likely sweep stops under it before weekly close
vwap is first hurlde after we break downtrend
above vwap this can go mental
there will be a blow off top for all alts the same way we felt the pain on the way down this should higher than expected

$ENSdips accross the board this bubba reclaim of 200 ema
looking for reclaim of previous range
should telelport to suppply above and make a HH
after which i shall be risking off to buy back on the lower high
general plan for alts over the next 3 odd months
ENS/USDT Weekly Outlook – “Massive Breakout Brewing from Base
Ethereum Name Service (ENS) is currently positioned at a critical inflection point on the weekly chart, signaling a high-probability setup for a massive bullish breakout after nearly 2 years of sideways consolidation and structural base building.
🔍 Technical Pattern Breakdown
This chart reveals a macro Ascending Triangle formation developing since late 2022, with higher lows consistently respecting a rising trendline support and price now retesting the golden pocket Fib zone.
Pattern Formed:
📐 Macro Ascending Triangle + Fibonacci Confluence Zone
📉 Long-Term Accumulation Range: $14.6 – $23.7
Trendline Support:
✅ Rising since 2023, showing buyers consistently stepping in at higher levels
Fibonacci Retracement:
🔑 Price currently sitting between 0.5–0.786 Fib zone from the 2023 rally:
0.5 = $18.33
0.618 = $16.82
0.786 = $14.68
🟢 Bullish Scenario – Potential Multi-Leg Rally
If price holds and rebounds from this support region, we could see a stepped breakout with key resistance levels being taken out one by one:
1. First Resistance – $23.73: Psychological and structural breakout level
2. Second Target – $30.48: Prior major rejection area
3. Third Target – $47.13: 2024 resistance high
4. Macro Target – $69.99 to $85.88: Full breakout potential from triangle width and historical ATH zone
🚀 Upside Potential from Current Levels (~$18): Over 350%
📈 This would confirm the end of the accumulation cycle and signal the start of a long-term bullish phase.
🔴 Bearish Scenario – Breakdown Risk
In the event of a confirmed weekly candle closing below $14.6, we invalidate the ascending triangle and shift bias toward bearish retracement:
Next Support: $10.00
Extreme Bearish Target: $6.65 (macro low from 2022)
🛑 Breakdown from this structure would suggest failure of the accumulation pattern and return to long-term bearish pressure.
💡 Strategic Insight
ENS is one of the rare altcoins currently forming a clean high-timeframe bullish setup. This is the kind of structure institutional or swing traders look for when anticipating early entries before explosive moves.
With a tight invalidation below $14.6 and multiple upside targets, this setup provides a strong risk-reward opportunity.
#ENS #ENSUSDT #AltcoinBreakout #CryptoSetup #Accumulation #TechnicalAnalysis #CryptoTrading #SwingTrade #Fibonacci #AscendingTriangle

ENS/USDT Elliott WavesWe are most likely entering the 4th wave. Correlated charts such as CRYPTOCAP:BTC and CRYPTOCAP:OTHERS are showing a similar directional bias.

Ethereum Name Servise ENS price analysisFor the second day in a row, trading volumes on the CRYPTOCAP:ETH futures market have exceeded those of CRYPTOCAP:BTC
(Is the market alpha returning or are profits being locked in? Write your thoughts in the comments ?)
💡 And we will write an analysis of the possible movement of the NYSE:ENS price — this is the #Ethereum Name Service management token, which is used to manage the protocol and influence pricing decisions for its .eth addresses and price oracle.
👌 Currently, all forces are preventing the OKX:ENSUSDT price from consolidating above $23.6. But when that happens, it will be a very safe level to buy on a retest.
📊 More risky, but with greater earning potential, are purchases at $17.50 and $14.50.
Set your “buckets” for purchases and wait for them to “fill up.”
And then, who knows, maybe in 2025, the price of NYSE:ENS will reach its ATH.
_____________________
Did you like our analysis? Leave a comment, like, and follow to get more

The key is whether the price can hold above 25.06
Hello, traders.
If you "Follow", you can always get the latest information quickly.
Have a nice day today.
-------------------------------------
(ENSUSDT 1D chart)
The key is whether the price can be maintained by rising above the important support and resistance zone of 20.93-25.06.
If it fails to rise, it is likely to fall to the support zone of 11.86-14.61, so you should think about a response plan for this.
However, the 20.93 point is a volume profile zone, so you should check whether it is supported when falling to this area.
If it starts to rise,
1st: 28.15
2nd: 33.54
The 1st and 2nd areas above are likely to act as resistance.
-
The indicators used as basic trading strategies are the HA-Low indicator and the HA-High indicator.
The basic trading strategy is to buy near the HA-Low indicator and sell near the HA-High indicator.
However, if it is supported by the HA-High indicator and rises, it is likely to show a stepwise upward trend, and if it is resisted by the HA-Low indicator and falls, it is likely to show a stepwise downward trend.
Therefore, the trading method should be a split trading method.
The end of the stepwise upward trend is a decline, and the end of the stepwise downward trend is an increase.
Therefore, if you buy when the HA-High indicator is supported and rises, a short and quick response is required.
Accordingly, it is not recommended to use the HA-High indicator as the first purchase point.
If you are familiar with day trading, the HA-High indicator may also be a purchase point.
Currently, the HA-Low indicator is formed at the 14.61 point, and the HA-High indicator is formed at the 23.12 point.
-
Depending on the arrangement of the candles, the important support and resistance zones are in the 20.93-25.06 zone.
Therefore, regardless of the current HA-High indicator position, if it shows support above 25.06, it is a time to buy.
However, since the buy zone and resistance zone are close, a quick response is required.
Therefore, the support and resistance points drawn on the 1M, 1W, and 1D charts correspond to important trading strategy points.
In order to draw reliable support and resistance points, objective information is required.
Be careful because the support and resistance points drawn after starting a transaction may reflect your psychological state and become unreliable support and resistance points.
-
Thank you for reading to the end.
I wish you successful trading.
--------------------------------------------------
- This is an explanation of the big picture.
(3-year bull market, 1-year bear market pattern)
I will explain more details when the bear market starts.
------------------------------------------------------

Following ETH — but Faster? ENS Gearing Up for a Breakout🧠 Context:
▪️ A "cup and handle" formation is developing — a classic bullish continuation structure.
▪️ Price is consolidating just below the upper channel resistance, forming a local bull flag.
▪️ ENS may follow ETH’s movement — or even outperform — due to its lower liquidity, offering potentially greater upside.
📌 Key Notes:
▪️ A breakout and hold above the $27–$30 zone could trigger a strong move.
▪️ Target levels from the structure point toward the $47+ area.
✅ Conclusion:
ENS is shaping up as a high-reward candidate. With accumulation underway, limited liquidity, and a textbook cup & handle setup, this altcoin might be preparing for a major leg up — especially if ETH leads the way.

$ENS / USDT 1D FAKEOUT ON FLAG? Incoming Pump? 📊 $ENS/USDT Perpetual Contract – Daily Timeframe Analysis
🟢 Bullish Setup
A bullish flag is forming on the daily chart — a continuation pattern indicating potential upward movement.
- Price recently entered into the golden pocket of the Fibonacci retracement tool marked from $16.881 – $25.241 on the third touch of the flag's resistance, triggering a fakeout, it now rests in the first Fair Value Gap.
- The strong wick rejection on the 3rd retest of the resistance/supply indicates bearish strength, momentarily pushing price lower.
- Despite this, the overall pattern remains valid as long as price respects the Golden Pocket and FVG zone below.
✅ If price closes above the golden pocket, it could present an excellent leveraged entry or spot position, with high reward potential off 67%.
🔴 Bearish Scenario
- So far, every test of the **4H supply zone** has resulted in rejection — showing persistent seller control at short-term resistance.
- If buyers fail to defend the golden pocket and recover the bullish trendline, the structure confirms a break. (Downtrend)
The confirmation of bearish pressure is the:
1) Large wick (Creating a shooting start candle pattern)
- Signaling bearish reversal.
2) Large Bearish Marubozu Candle.
- Indicates strong continuation of a downtrend.
3) Candle close below Trend line support.
- Showing Bears were able to successful make a major move.
🔽 In that case, we look to short after FVG confirmation and scalp down toward the daily demand zone.
📌 Patience is key. Let the price show intent before entering.
Please let me know what your thoughts are!

ENS bullish flag setup — Flag Consolidation AboveBINANCE:ENSUSDT is consolidating within a bullish flag pattern, holding above key structural support. Price is respecting multiple confluences including the OB cluster, 4H 200MA, and 1D S/R flip, keeping the long bias intact.
Buy Zone:
🟩 $19.75–20.80
• Best area to bid inside flag structure
• OB cluster + MA confluence = high probability support
• Structure remains bullish above $20.35
📌 Breakout Target: $30.13
• Break of flag resistance = momentum trigger
• Expect chop and fakeouts before breakout — patience required
🚫 Invalidation:
• Clean break below $19.75 = exit or reassess
Summary:
Strong trending structure with healthy consolidation. Best strategy: buy the dip into support and wait for a flag breakout toward $30.

ENSUSDT - GAMEPLANAlright everyone, focusing on ENSUSDT. The current price action suggests that the immediate target for this move is the blue line I've marked on the chart. This line represents a key level that the market is currently aiming for.
Beyond that, looking lower, you'll see a blue box that I consider to be a beautiful support zone. This area is where I anticipate strong buying interest could emerge, potentially halting any further downside.
As always, my approach is rooted in confirmation. If price reaches the blue line, I'll be scrutinizing the volume footprint to understand the true intentions of market participants. Are we seeing signs of distribution, or is there genuine momentum to push through? I'll also be watching for any CDV (Cumulative Delta Volume) divergences that might signal a shift in the underlying order flow.
Should price retreat towards that lower blue box, I'll be looking for low timeframe (LTF) confirmations to validate its strength as support. A clean retest and bounce from this zone, especially with an uptick in buying volume, would be a strong signal.
Remember, I exclusively focus on assets that show a sudden and significant increase in volume. This selective approach helps me concentrate on where the market is truly showing its hand. ENSUSDT's current movements, coupled with its potential to interact with these key levels, make it an interesting watch.
Keep these levels on your radar. The market is always speaking, and by paying attention to these nuances, we can decipher its true intentions. You can trust my perspective to guide you through these intricate market dynamics.
📌I keep my charts clean and simple because I believe clarity leads to better decisions.
📌My approach is built on years of experience and a solid track record. I don’t claim to know it all but I’m confident in my ability to spot high-probability setups.
📌If you would like to learn how to use the heatmap, cumulative volume delta and volume footprint techniques that I use below to determine very accurate demand regions, you can send me a private message. I help anyone who wants it completely free of charge.
🔑I have a long list of my proven technique below:
🎯 ZENUSDT.P: Patience & Profitability | %230 Reaction from the Sniper Entry
🐶 DOGEUSDT.P: Next Move
🎨 RENDERUSDT.P: Opportunity of the Month
💎 ETHUSDT.P: Where to Retrace
🟢 BNBUSDT.P: Potential Surge
📊 BTC Dominance: Reaction Zone
🌊 WAVESUSDT.P: Demand Zone Potential
🟣 UNIUSDT.P: Long-Term Trade
🔵 XRPUSDT.P: Entry Zones
🔗 LINKUSDT.P: Follow The River
📈 BTCUSDT.P: Two Key Demand Zones
🟩 POLUSDT: Bullish Momentum
🌟 PENDLEUSDT.P: Where Opportunity Meets Precision
🔥 BTCUSDT.P: Liquidation of Highly Leveraged Longs
🌊 SOLUSDT.P: SOL's Dip - Your Opportunity
🐸 1000PEPEUSDT.P: Prime Bounce Zone Unlocked
🚀 ETHUSDT.P: Set to Explode - Don't Miss This Game Changer
🤖 IQUSDT: Smart Plan
⚡️ PONDUSDT: A Trade Not Taken Is Better Than a Losing One
💼 STMXUSDT: 2 Buying Areas
🐢 TURBOUSDT: Buy Zones and Buyer Presence
🌍 ICPUSDT.P: Massive Upside Potential | Check the Trade Update For Seeing Results
🟠 IDEXUSDT: Spot Buy Area | %26 Profit if You Trade with MSB
📌 USUALUSDT: Buyers Are Active + %70 Profit in Total
🌟 FORTHUSDT: Sniper Entry +%26 Reaction
🐳 QKCUSDT: Sniper Entry +%57 Reaction
📊 BTC.D: Retest of Key Area Highly Likely
📊 XNOUSDT %80 Reaction with a Simple Blue Box!
📊 BELUSDT Amazing %120 Reaction!
📊 Simple Red Box, Extraordinary Results
📊 TIAUSDT | Still No Buyers—Maintaining a Bearish Outlook
📊 OGNUSDT | One of Today’s Highest Volume Gainers – +32.44%
I stopped adding to the list because it's kinda tiring to add 5-10 charts in every move but you can check my profile and see that it goes on..

#ENS/USDT#ENS
The price is moving within a descending channel on the 1-hour frame, adhering well to it, and is heading for a strong breakout and retest.
We are experiencing a rebound from the lower boundary of the descending channel, which is support at 22.00.
We are experiencing a downtrend on the RSI indicator, which is about to break and retest, supporting the upward trend.
We are looking for stability above the 100 Moving Average.
Entry price: 22.37
First target: 22.80
Second target: 23.17
Third target: 23.69

Buy Trade Strategy for ENS: Powering Web3 Identity InfrastructurDescription
This trading idea highlights ENS (Ethereum Name Service), the native token powering the decentralized naming protocol built on Ethereum. ENS simplifies blockchain interactions by replacing complex wallet addresses with human-readable names, which is essential for enhancing user experience and promoting mainstream Web3 adoption. As decentralized applications and wallets integrate ENS for smoother onboarding and interoperability, its relevance continues to grow. Additionally, ENS holders participate in governance, shaping the future of the protocol, giving the token both utility and community-driven value.
The rise of Web3 and decentralized identity solutions puts ENS in a favorable position long term. However, the crypto market remains unpredictable, subject to rapid shifts due to regulatory, technological, or economic factors. As such, any investment in ENS should be approached with a clear strategy and sound risk management.
Disclaimer:
This trading idea is for educational purposes only and does not constitute financial advice. Cryptocurrencies, including ENS, are speculative assets and carry high risks, including total loss of investment. Always perform independent research, evaluate your financial situation, and consult a licensed advisor before making investment decisions. Past performance is not indicative of future results

ENSUSDT 12H AnalysisENS ~ 12H Analysis
#ENS Buy gradually after successfully breaking through this resistance line with a short-term target of at least 15%++ And long term target $50++

Ethereum Name Service (ENS) Leaves Accumulation ZoneHere we have two accumulation zone. The "bottom" zone coming at the end of the 2022 bear market and in late 2023, between June and December. And the "higher low" zone which started after the early 2024 bullish breakout.
This latter zone was activated April-May 2024 (1), August-November 2024 (2) and March-April 2025 (3). With the last activation of this zone ENSUSDT ended its correction and is now bullish.
Last week was a consolidation week and within the next two weeks we can have a bullish continuation, the resumption of the bullish move that started with the 7-April low.
Good morning my fellow Cryptocurrency trader, how are you feeling in this wonderful week?
What is a good opportunity?
A project that has really good potential for growth and at the same time, high certainty, sure to grow and stable. This pair has those qualities.
We also want a good entry price and timing. Timing is good all across.
Entry prices could be better but that would be being greedy. If ENS can move beyond $100, easily, then anything below $25 can be a good entry. Of course, a price of $15 is many times better, but not everybody can buy at $15 at the same time. And being honest, it is not easy to catch the exact bottom. We can even see it happening but our finances might not be in the right place when this is happening or some other situation prevents us taking action, but it is never too late. The market always offers a second chance and this chance is now.
Ethereum Name Service has great potential for growth. My strategy is very simple, buy and hold. Set a sell order 300%-500% above my entry level, when it fills, look for a pair that is still trading at bottom prices and repeat.
If you are glued to your screen, you can track the market and sell higher. Or you can sell portions at each target, or you can hold long-term. There are many ways to approach the market, right now, it is not about selling but buying. Right now is the time to buy. Late 2025 is the time to sell.
Thank you for reading.
Namaste.

ENS SWING Trade SetupENS Showing strong momentum towards upside and dropped without touching POI, So it can go higher first then it may take correction, spot and future trader can take risk on this. Wait for the entries and enter from 20-19 level, if price reverse from any other point, then wait for the 4hrs candle closing above 26 and target the 30-32$ level. for scalp and day trading get long from 22.40 SL 21.65 and set tp 25.56 & 27.79$.

ENS | HTF ANALYSIS
BREAKDOWN
- HTF Charts looks decent,
However, want some bids fill @ 18.317ish confluencing the daily bpr (breaker block) that did act as a Magnet for price before we head into the expansion phase,
- Not Super bull but Great Web3 identity concept, imo will gain
its traction overtime as we head into the Q3 Ens did have some more
- Momentum CVD influx backing the UseCase narrative more,
- While bullish Rsi Divergence on the monthly timeframe,
DCA REGION
- 18.317
TARGETS
Trim regions targetting @ 47.079 - 61.323ish

ENS ANALYSIS📊 #ENS Analysis
✅There is a formation of Falling Wedge Pattern on 12 hr chart and currently trading around its major support zone🧐
Pattern signals potential bullish movement incoming after the breakout of resistance 1
👀Current Price: $22.58
🚀 Target Price: $31.29
⚡️What to do ?
👀Keep an eye on #ENS price action and volume. We can trade according to the chart and make some profits⚡️⚡️
#ENS #Cryptocurrency #TechnicalAnalysis #DYOR

ens📊 Macro Analysis + 1H Trigger — (ENS)
On the monthly timeframe, ENS is printing a strong indecision candle on a key support zone. This could signal either profit-taking from sellers or a potential buyer reversal.
2/
🔍 Key takeaway:
If we see a sharp move upward → buyers are stepping in.
If the market chops or pulls back → likely seller exit or weak buyer presence.
3/
Weekly TF: strong structure
Daily TF: signs of a new bullish cycle
4H TF: price in a range
1H TF: fakeout below support followed by 2 taps on resistance, with rising green volume candles ✅
4/
📈 Price is currently pushing toward 19.08 with notable buyer momentum.
The ENSBTC pair is also showing signs of bullish reversal.
⛳ Buy stop entries look valid.
