Eos hitting triple bottom good for a long....little bit riskyEos hitting low on the daily, lots of support at this area I'm seeing a big long position, my stop loss is a bit tight.....
Lets see what happens???
EOSBTC trade ideas

EOS BTC - EOS sitting on strong support 20% gainsHi.
We are looking at one of the top cap Altcoins - EOS.
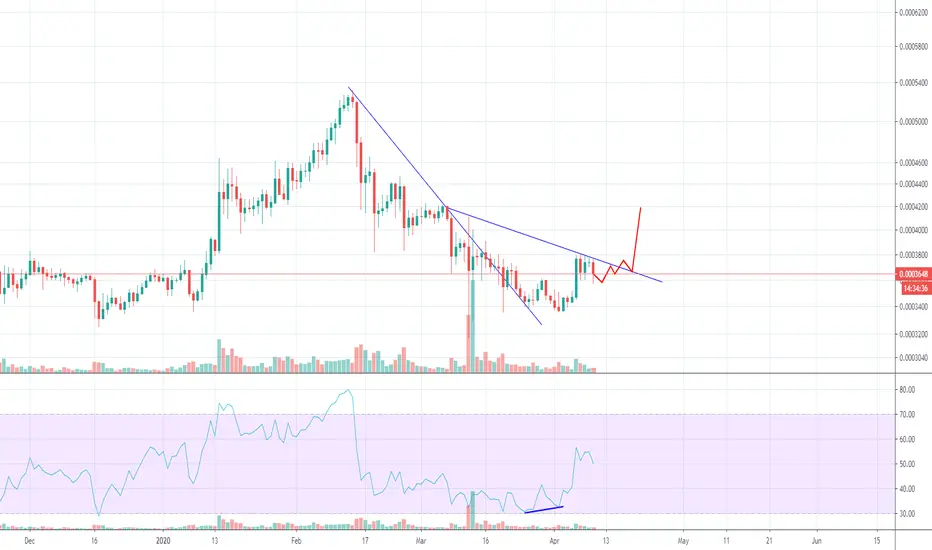
EOS lose some steam due Bitcoin crazy ride, but it stopped right where the really strong support is. That support line holds from September 2019, so for now it was a great accomulation zone.
There is also a reistance trendline which EOS will try to break in the following weeks. From that, there are no middle resistances. So this could bring us 20% gains.
However I would suggest to put stoploss at ~ 32833 sats, if Bitcoin decides to make another parabolic move.

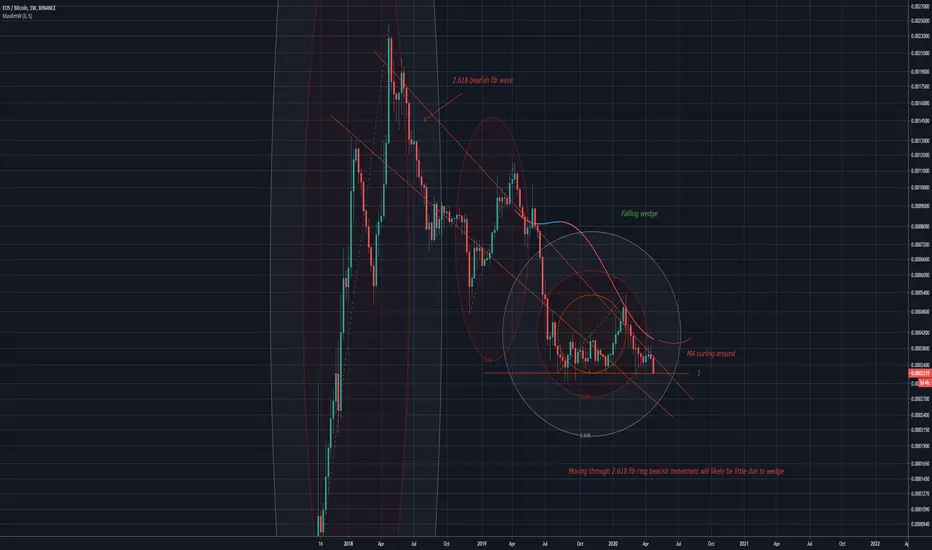
EOS IdeaAn idea for EOS supporting my prior falling wedge idea
Using Fibonacci rings to try and decipher the momentum of price linking previous analyses
My fibonacci waves idea
And my idea that looks like a claw lol
EOS/BTC simple analysesHello Traders,
EOS/BTC is now testing a important support level, which is a key level for this asset, if we remain above this level, the bulls will take control of the the price one more time, and we can be heading to test the long term resistance line, but for now is time do do nothing and wait to see if this support will hold the price above, after como reversal candle stick pattern we can go long in this asset.
Please like this post and leave your comment.
You are welcome to follow us on our social networks.


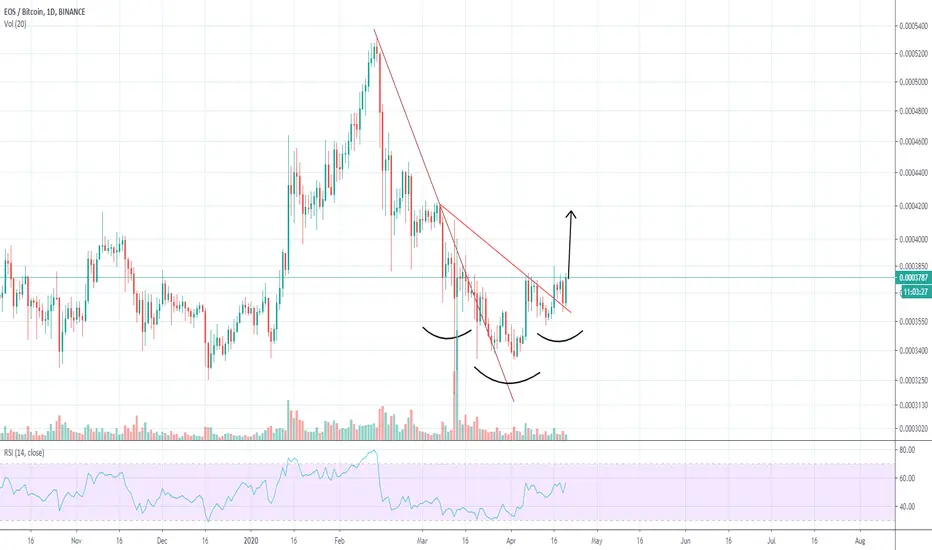
EOS Will Also Jump (Analysis Before The Breakout)We can see Tron (TRXBTC) and Ripple (XRPUSD and XRPBTC) printing a bullish breakout, Cardano (ADABTC) has been going up for the past two weeks.
Here we have EOS (EOSBTC) with prices still trading below resistance in the form of EMAs.
EOSBTC is trading below EMA10 and EMA50, which gives it bearish potential.
Now, prices are trading within a falling wedge and the chart looks similar to TRXBTC and XRPBTC before their breakout.
We believe that EOSBTC will also go bullish pretty soon.
Additional details on the chart.
Thanks a lot for reading.
Namaste.

Candlestick Analysis - Prac 24h - bearish
1. Strong bearish trend
2. Multiple doji's indicated showing strong indecision in the market
3. Overall, with their being a lack of positive indication that there will be a bullish momentum, I wouldn't enter the market. I think that buyers are holding on and waiting till it reaches the next point of support before it potentially goes bullish

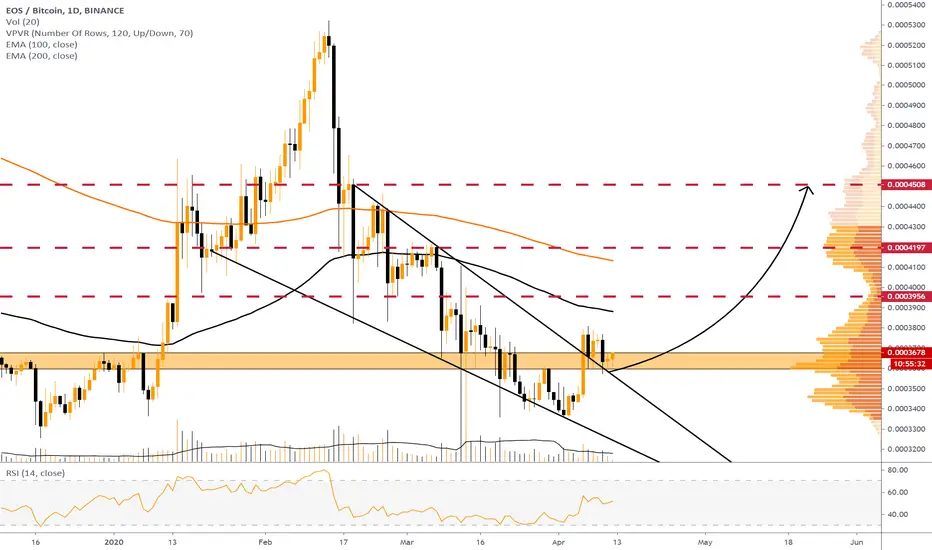
EOS ANALYSIS: LONG OPPORTUNITY PRESENTEOS ANALYSIS:
EOS has been trending in a downward channel since breaking down from recent highs. The RSI is breaking down into an oversold territory as it flats out upon each drop showing signs of life of buyers coming back into play. There is an expected bounce coming in and long opportunity from the zone of 3300-3400 sats. This support has held very strongly in the past. Take profit targets are lasted at T1 of 3590 sats, T2 at 3720 sats, and T3 at 3848 sats. Major MAs are coming down, and could possible break back below 200MA. Therefore, take profit by T3 as it is the major line of resistance now.
Possible Entries: 3300-3400 sats

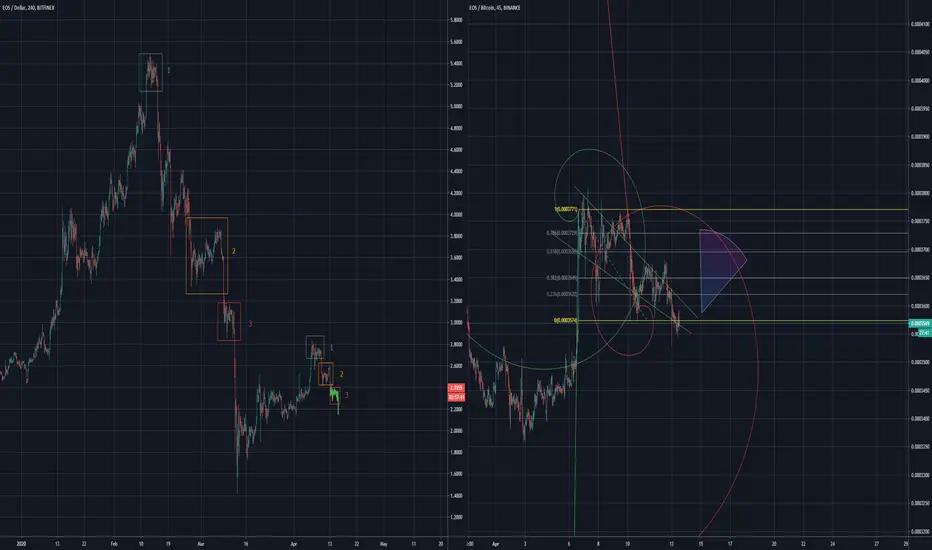
EOS vs BTC Update: as plannedUpdated EOS vs BTC chart from earlier: Bullish EOS C-fork setup complete (supported by "meh" looking iH&S) - strong bounce off the fork line.
Would be aiming at 4100-ish sats as target here.
EOSBTC Moving in a Fractal!?Hi all, I don't usually trade patterns like this such as fractals. This is my first, so I'd love to hear from you... the community of Tradingview! Please give me feedback on this idea and let me know how to improve it. Perhaps you can share some ideas you made with fractal set-ups?
I believe if I do everything correctly, we can look for similar patterns that happened in the past. Then, we can use those patterns and apply them on the present. Since everything matches so perfectly before, we can monetize the scenario the fractal holds and the price keeps moving exactly how we expect.
Follow me for consistent high quality updates, with clear explanations and charts.
Please like this post to support me.
- Trading Guru
--------------------------------------------------------------
Disclaimer!
This post does not provide financial advice. It is for educational purposes only!


EOS slowly moving up🚀EOS is moving slowly towards our Target. If you have longed, make sure you took some profits and move stops near to entry.
For bitmex signals, join our telegram channel
t.me/bitmexmasters

EOS Small pump?EOS Looks Ready For A Small Pump Towards 3900-4000 where We Have Strong Supply Zone. You Can Long by managing Your Risk.
For Bitmex signals, you can join our telegram channel t.me/bitmexmasters
Plz like and comment your opinion.
Thank you!!


EOS showing momentumPlease feel free to comment on my charts with your thoughts or remarks!
- Yellow line = long term resistance (since 26th of april 2018)
- Yellow line is forming a long term descending triangle with the weekly support @ 3347 satoshi's
- Broke out of a falling wedge and is now in an upward channel
- If momentum lasts I'm expecting a test @ 4010 satoshi's before we head back down
A lot will be riding on the moves of bitcoin.

EOS/BTC BULLISH SIGN RSI SUPPORT WEEKLYStrong support weekly vs monthly resistance tager clear 5000 sat
Good luck

ALTSEASON STARTS NOW - XRP AND ALTS ARE ON ------- HIGH ALERTHi I am MartyBoots and i've been trading the markets for 13+ years
POLONIEX:XRPBTC
This could be the most important video you EVER watch
Just sit back and enjoy, we have all been waiting on this day
ALTSEASON STARTS NOW - XRP AND ADA ON HIGH ALERT
XRP / ADA and almost ALL ALT coins have formed beautiful bottoming patterns , these opportunities dont happen often to allow us get in on the lows of stocks or coins that have serious potential to move into a bull market . We need to grab these opportunities with both hands .
Do not miss this video because if this pattern plays out then this is the low on XRP before bull market moon time .
The price action and the moving averages are setting up beautifully. On top of that the indicators are also setting up .

EOS Mixed signalsEOS showing some mixed bearish and bullish signals, i know the pairs are different.
While #EOS Already Did a Breakout :)And EOS looks bullish as well, even better than #LTC did. The falling wedge was broken upwards and currently the price is testing the upper descending level of the wedge. As long as the price remains in the orange zone - the priority is upward. All three targets were mentioned on the chart.
Keeping an eye on EOS vs BTC. Potential C-fork in the makingJust keeping an eye on EOS - bullish Chuvashov fork may be in in the making on daily.
Not trading this before it breaks out and confirms.
BTC volatility is an important variable here.
EOS going to 50 and then to 61.8 fibo retracement?we catched btc, zec, dash & atom pamps, now we try to catch EOS pamp
entry: 3730-3740
size: medium
tp: 3960
50 and 61.8 fibo
good luck

EOS/BTC - squeezy, squeezy !Indecisiveness - that´s the right word, that describes current situation in crypto space. Eos/btc can´t go sideways forever and it has to decide, what will be the direction for that big volatile move. We should see this move within several hours or few days.
